 Performanc…")
Bitcoin’s (BTC) golden run may soon end, according to Joao Wedson. The founder and CEO of Alphractal revives the fractal-cycle debate by arguing that Oct. 2025 marked a possible Bitcoin cycle peak. However, many X-based analysts continue to find bullish signals embedded in the BTC price charts.
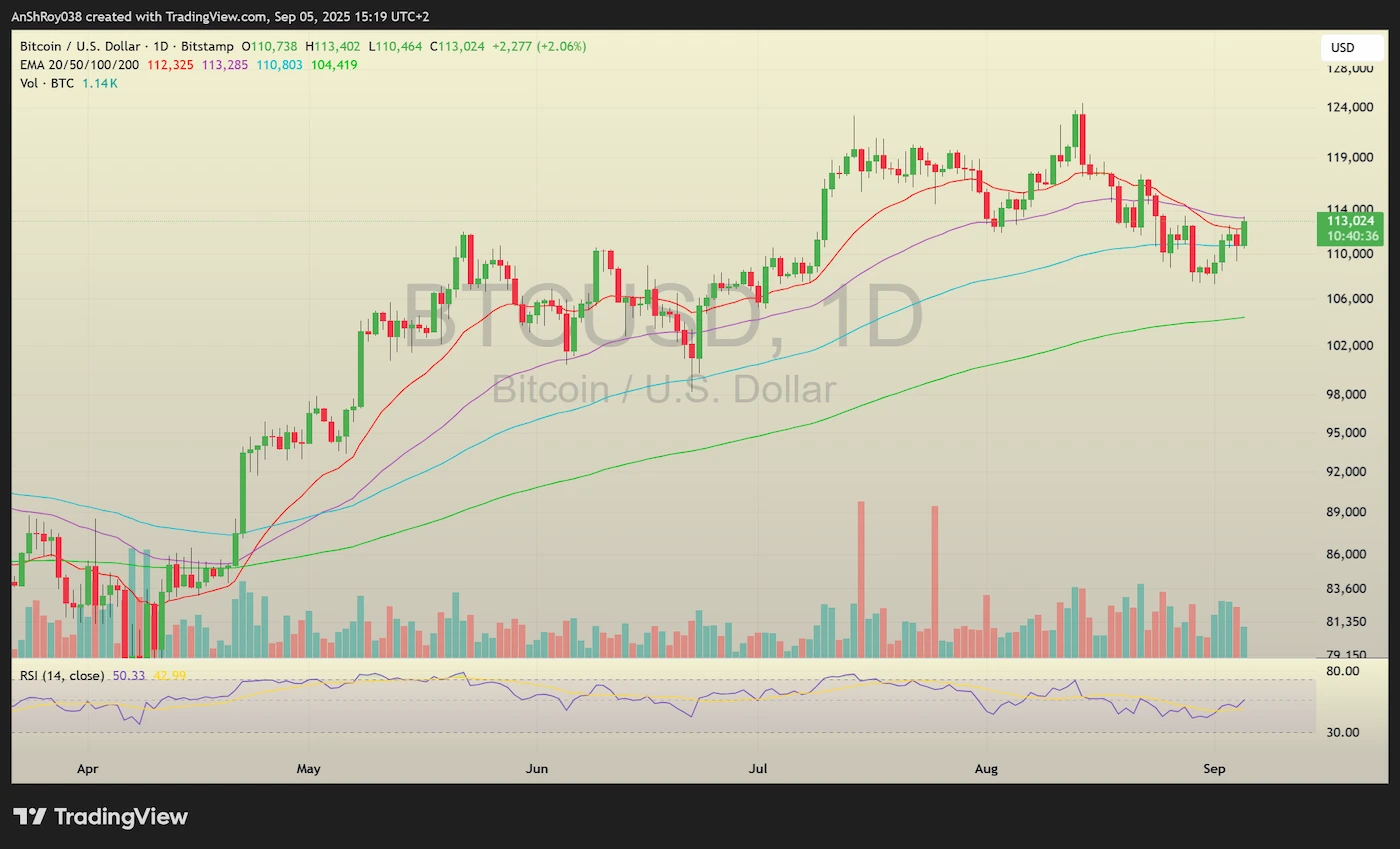
Bulls seem to have re-entered the market, with the BTC USD pair breaking past $113,000 for the first time in Sept. 2025. However, the token has failed to hold above the level, suggesting bears are defending the region near the 50-day EMA (purple).
Meanwhile, in a regulatory win for cryptos, Banco de Crédito del Perú (BCP) has executed the country’s first regulated crypto payment. This signals growing institutional interest in digital finance. Though the event did not endorse any existing crypto like Bitcoin, the experiment shows that banks could safely test blockchain payments. This eases regulatory concerns and prepares the ground for broader crypto adoption.
Wedson Revives the Fractal Cycle Debate
Joao Wedson reignited the cycle debate when he shared a detailed post on X.
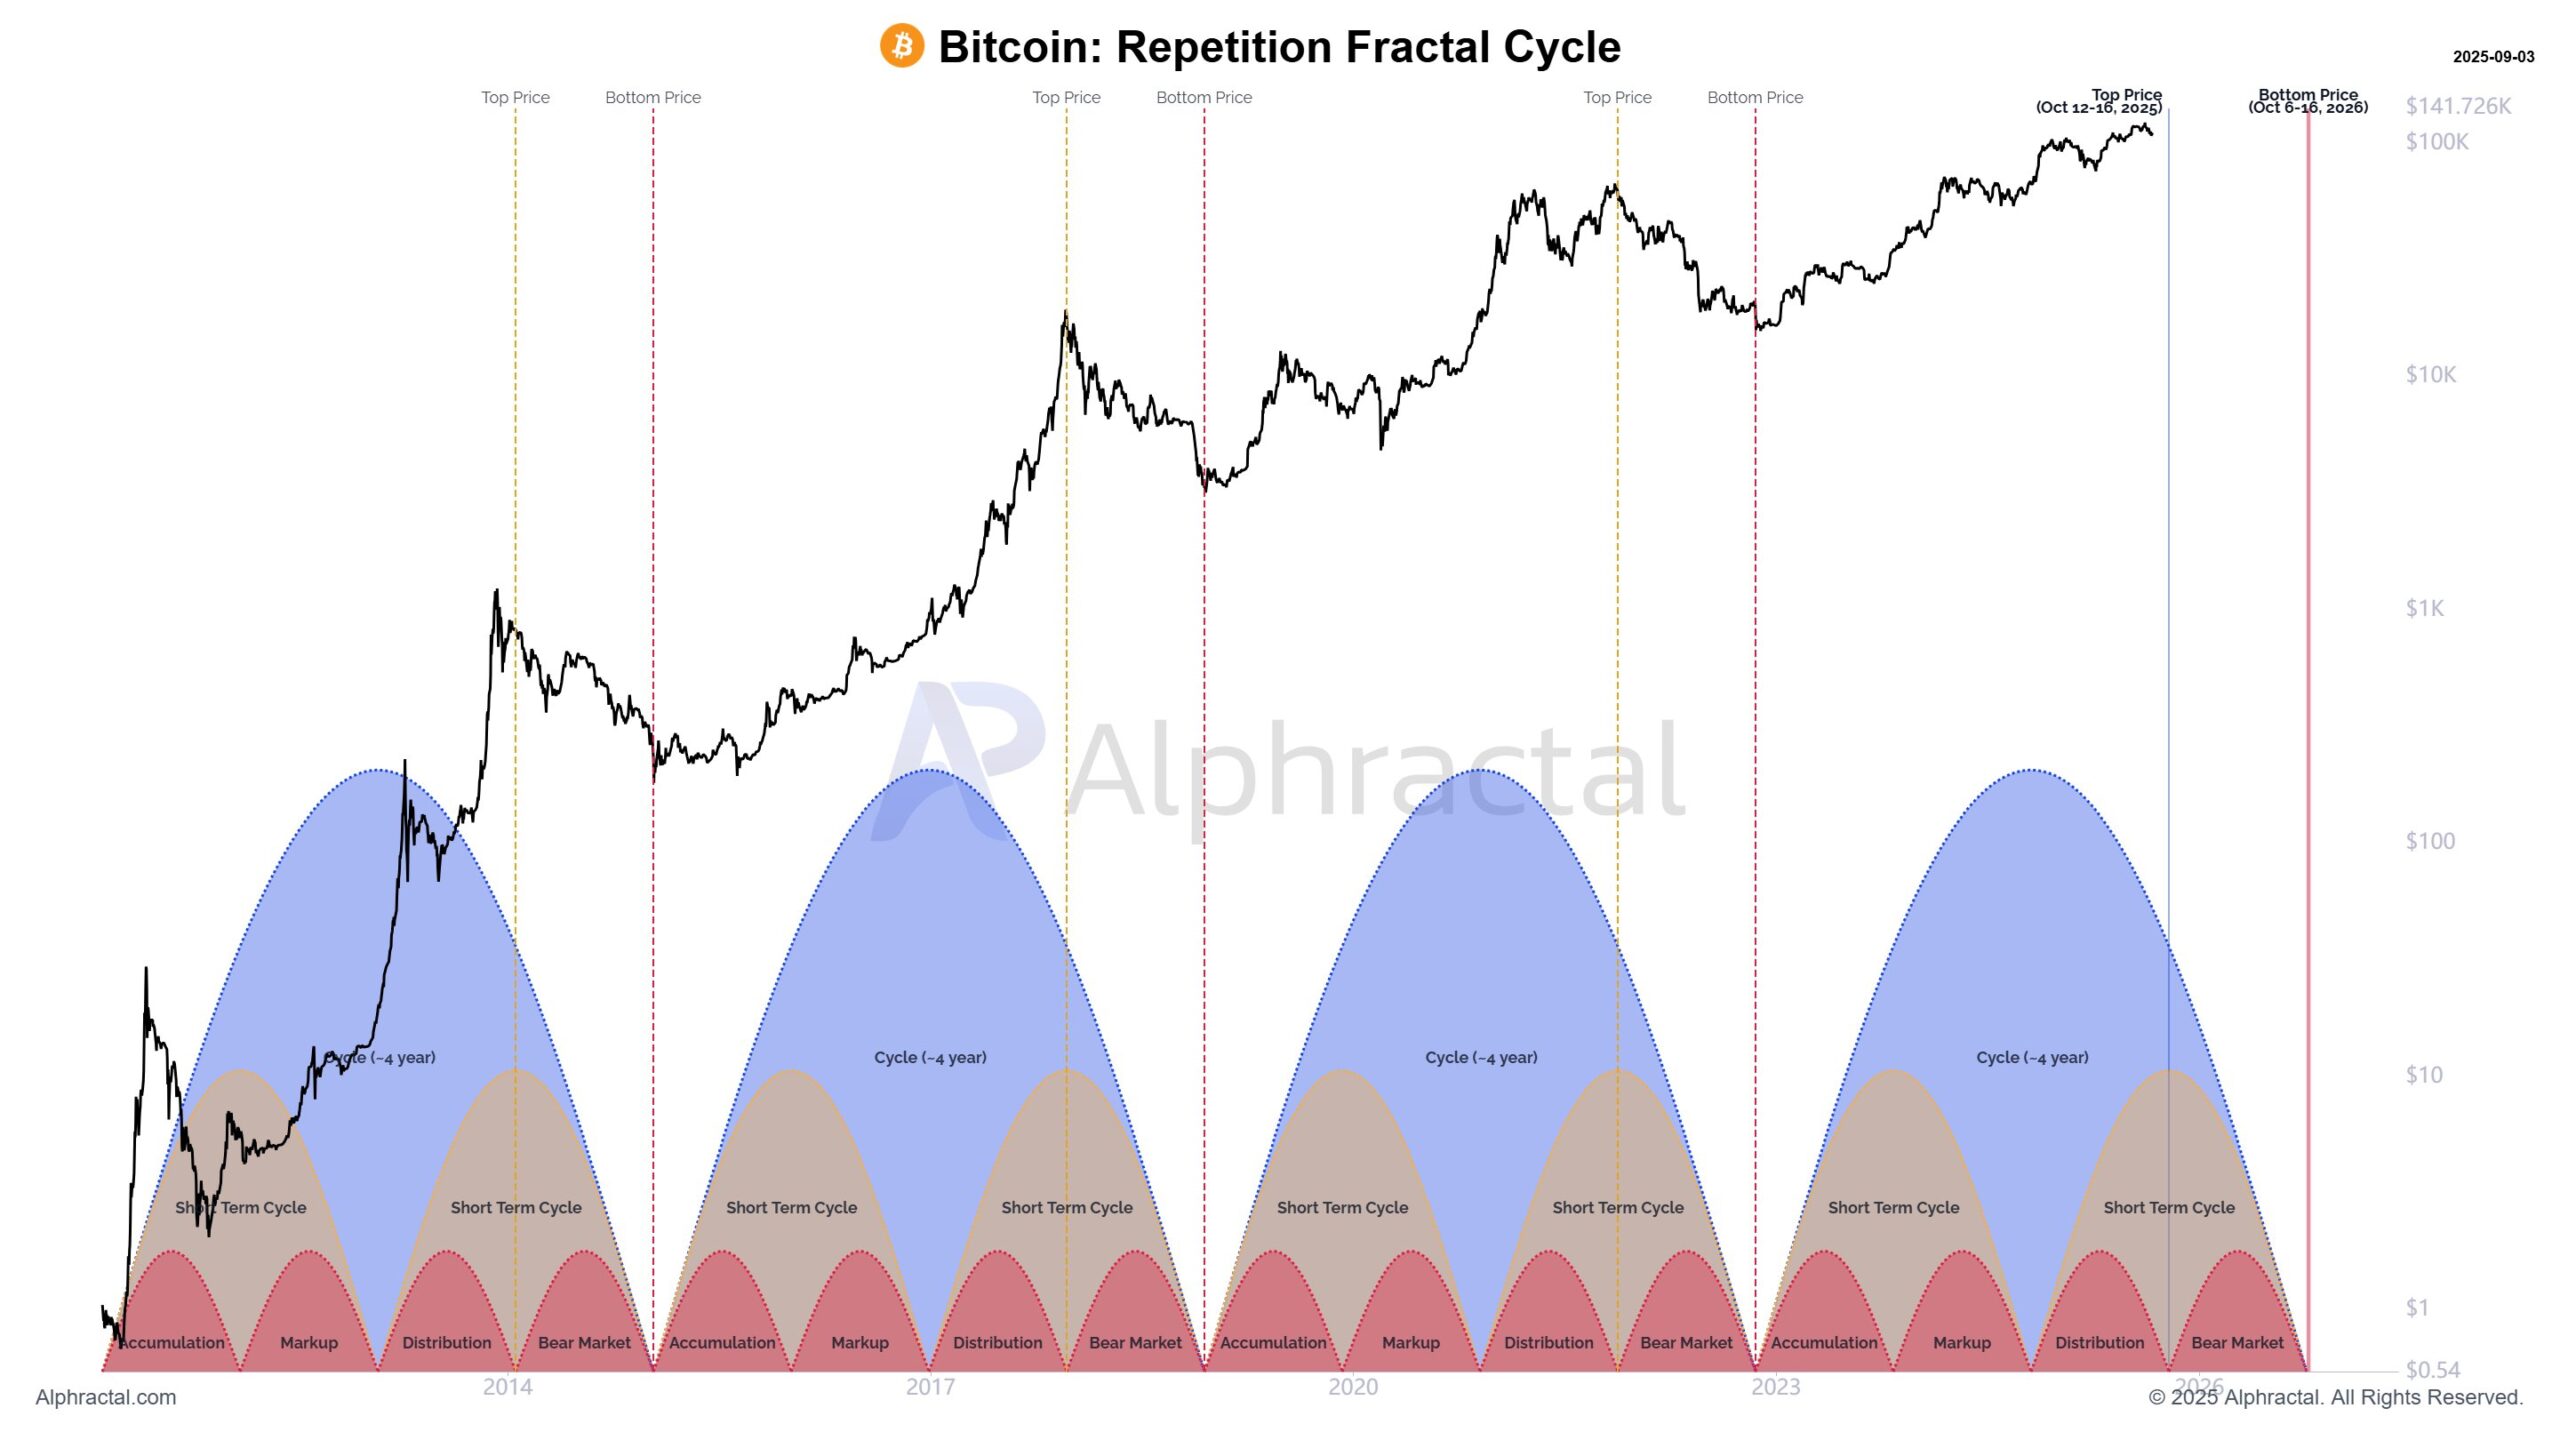
The post includes charts that mapped historic Bitcoin fractals against current price action. His analysis points toward October 2025 as a potential cycle top, followed by a steep correction through 2026.

Wedson bases his projection on repeating four-year structures visible in Bitcoin’s history. Each cycle features an extended accumulation, a parabolic run, and a decisive top before an extended drawdown. His chart overlays past peaks and troughs with current data, showing symmetry that places the next climax in the fourth quarter of 2025. The second chart extends the view into 2026, marking October as a likely cycle bottom.
Moreover, the analyst notes that Bitcoin could first dip toward $100,000 before a final surge above $140,000. That path, Wedson argues, would mirror past sequences where mid-cycle shakeouts clear excess leverage before late-cycle rallies. The Alphractal CEO acknowledges, however, that new forces such as ETF inflows, institutional holdings, and political catalysts could stretch or even disrupt the pattern.
Wedson warns that divergences are emerging on several indicators, suggesting that momentum might already be fading. He says familiar fractals might no longer provide perfect guidance under today’s market structure. Still, he insists the timing window remains consistent with Bitcoin’s prior behavior.
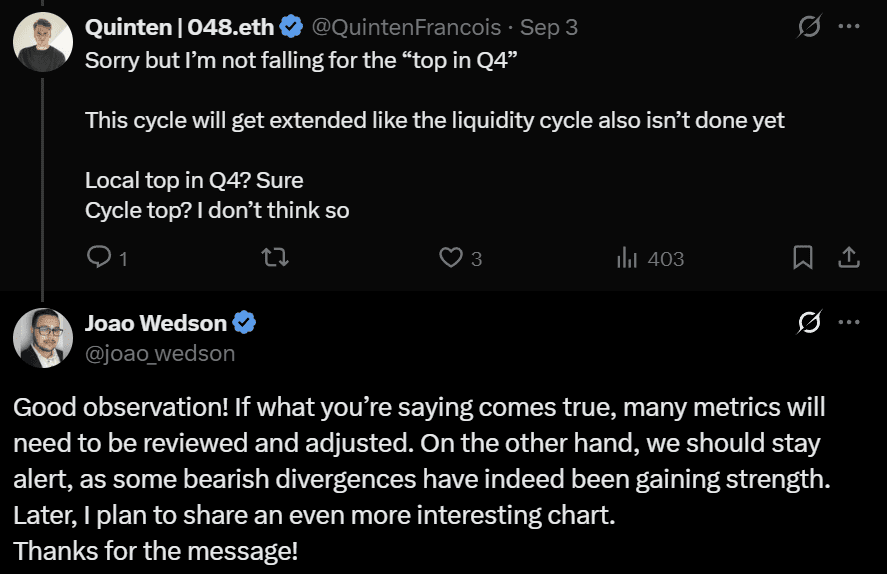
His post drew a swift reaction. Quinten, an independent X-based analyst, is “not falling for” the idea of a Q4 cycle top. Quinten argues that liquidity cycles remain incomplete and suggests Oct. 2025 could bring only a local peak rather than a final one.
Short-Term Optimism Challenges Wedson’s Bitcoin Cycle Warning
Wedson’s fractal analysis focuses on the long horizon, but short-term traders see a different picture. Wedson’s charts suggest Bitcoin could approach a cycle top by Oct. 2025 before tumbling into a drawn-out correction. That framework assumes that repeating four-year structures would continue to govern price behavior.
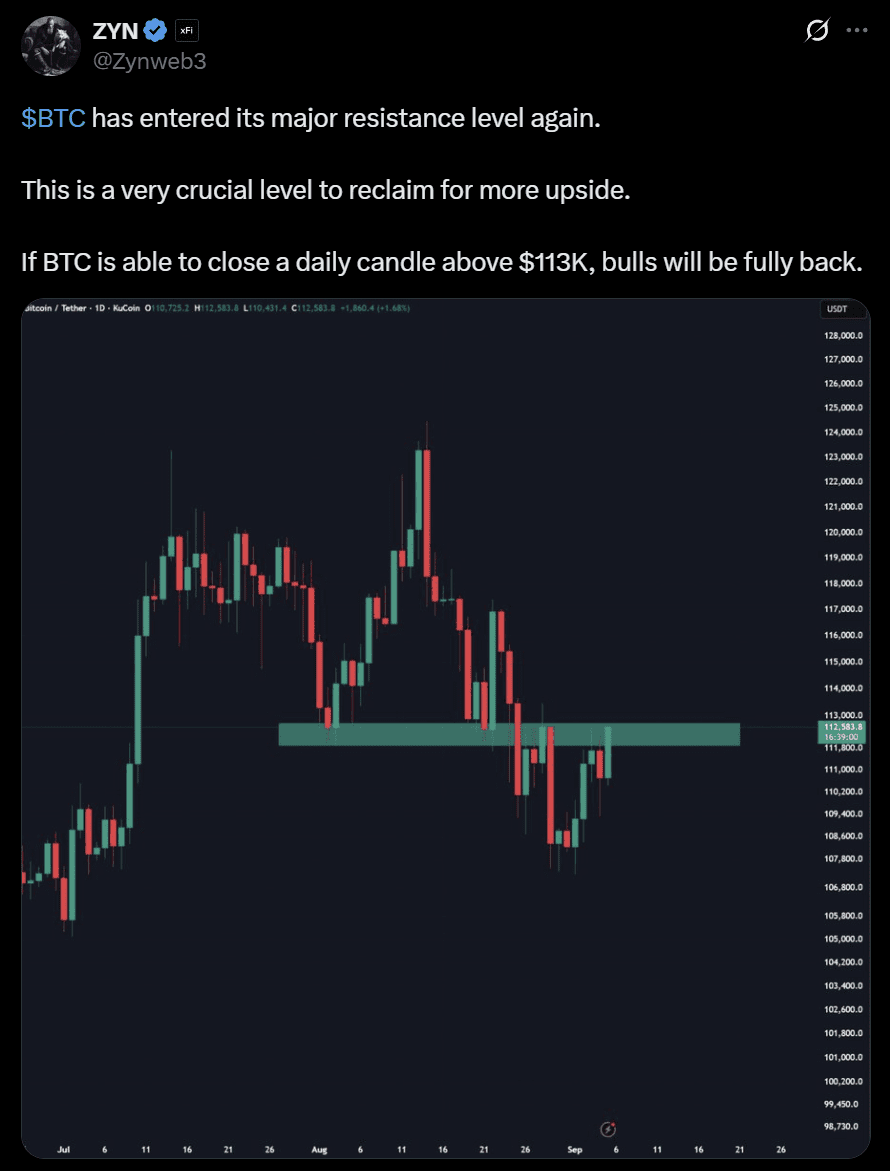
Short-term traders, however, read the charts differently. Zyn points to resistance at $113,000 as the decisive barrier for momentum. The analyst states that a daily close above that mark would revive bullish conviction. Crypto Fella emphasizes that Bitcoin’s rebound above $112,000 indicates that strength remains in the bull market. He believes that several strong months could still play out before exhaustion.
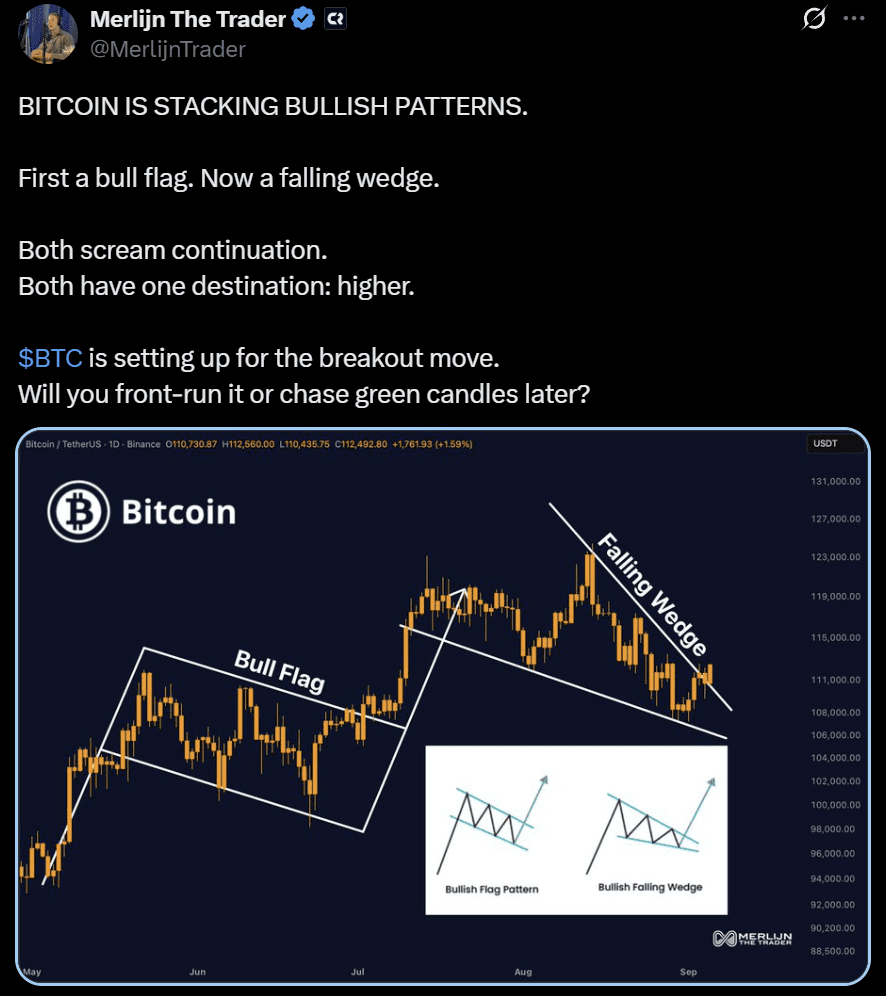
Merlijn the Trader focuses on chart structures that have developed over recent weeks. He identified a bull flag breakout in July 2025 and a falling wedge formation in August. Both patterns have historically signaled continuation, with falling wedges often preceding sharp rallies. The sequence, he argues, have positioned Bitcoin for a breakout that could retest August highs if resistance gives way.

BTC price action has supported those views in the near term. Buyers have repeatedly defended the $110,000 region, preventing deeper losses and keeping structure intact.
While Wedson warns of fading long-term momentum, the daily patterns point toward buyer resilience. The contrast captures a market split between analysts who trusted repeating fractals and those who weigh immediate technicals. With October just a few weeks away, market participants are wondering if it will be an Uptober, or a Rektober.