
XDC Network has flashed bullish signals in recent weeks, with fresh exchange listings and strategic investments bolstering its case. Yet, the token’s market performance has not kept pace with these cues. While sentiment points upward, XDC price action has remained subdued, leaving traders questioning whether the bullish momentum will eventually spill over into the charts or stall under broader market pressure.
Bullish Cues Strengthen Case
The XDC Network recorded a significant milestone when Kraken added support for its native token. The listing unlocked access for U.S. and international XDC users, marking a shift from speculation to regulated availability.

It positioned XDC alongside other assets vetted for broader market participation and gave the project a level of legitimacy that often fuels institutional curiosity. The development also promised stronger liquidity and higher visibility. These are two factors that historically support price traction when combined with positive sentiment.
Beyond the exchange debut, XDC Network secured a $1 million strategic investment into Kasu Finance, a lending platform focused on real-world assets.
The move underscored XDC’s ambition to integrate its trade finance infrastructure deeper into DeFi markets. By tying its brand and resources to Kasu, the network aimed to boost real yield offerings, stablecoin applications, and liquidity flows on-chain. The partnership also signaled XDC’s willingness to back projects. This aligns with its push into tokenized trade finance, where it has consistently positioned itself as a solution provider.
Together, the Kraken listing and the Kasu Finance deal reflected a broader play: to establish XDC both as an investable asset and as a protocol with concrete financial use cases. These moves strengthened the project’s narrative at a time when traders often dismissed many tokens as speculation.
Yet, despite the bullish cues, XDC’s chart has lagged behind the headlines. This raises the question of whether market performance would eventually catch up with the fundamentals.
XDC Price Action: Author’s Take
The XDC USD pair traded near $0.078 after failing to break above a descending trendline that capped the market since mid-August. The token hovered around the 50% Fibonacci retracement level, which sat close to $0.077, underscoring its importance as a pivot zone for near-term sentiment. Momentum indicators backed the indecision, with the daily RSI holding near 43, reflecting weak buying pressure after a sharp summer rally.
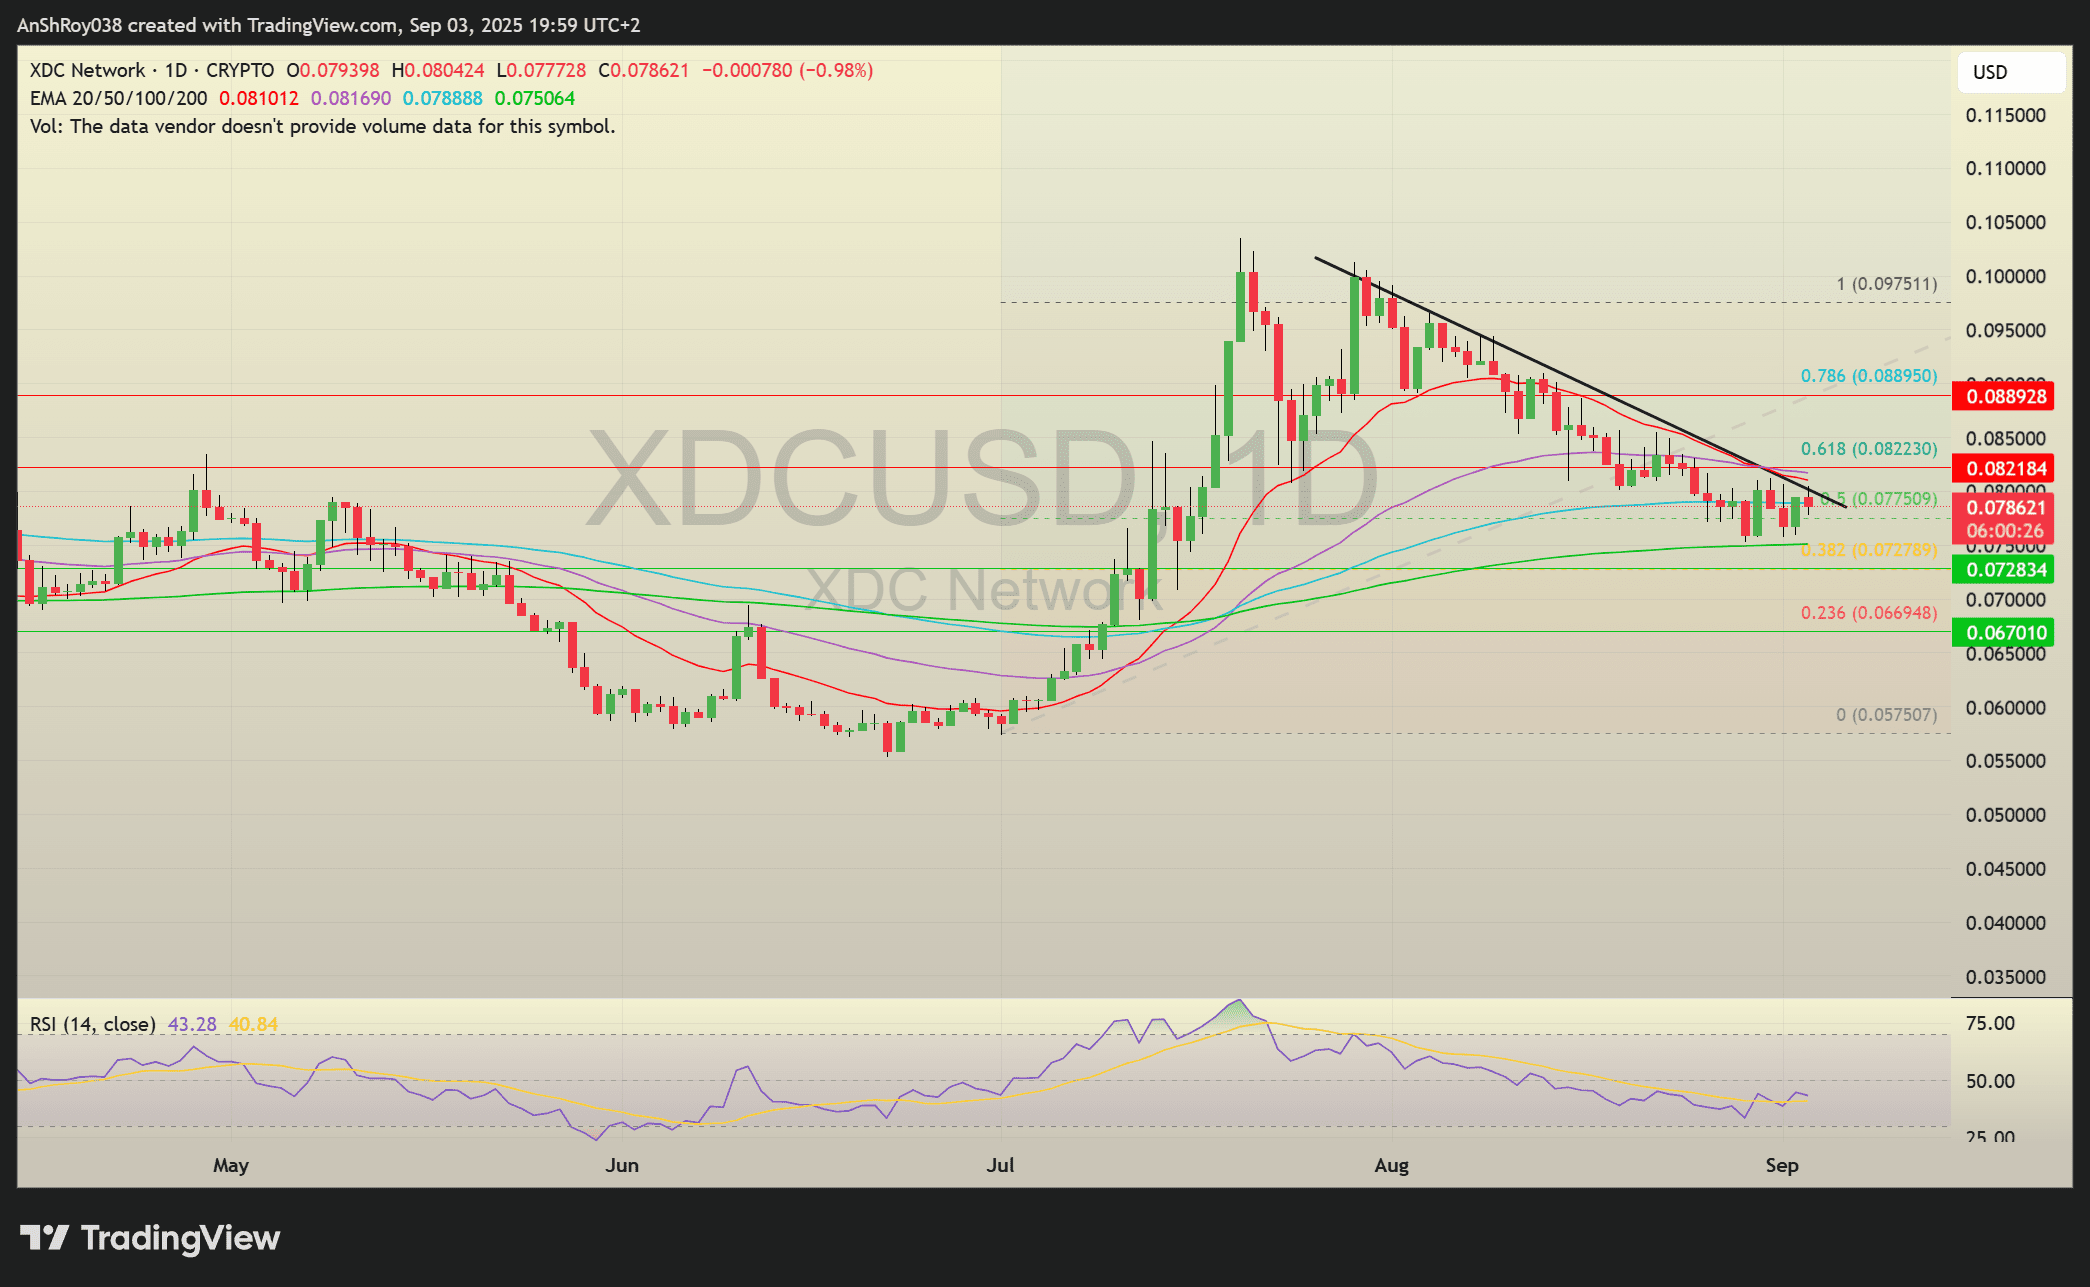
The 200-day EMA, just above the 38.2% Fibonacci retracement support at roughly $0.073, cushioned the downside. Bulls seemed to defend the EMA support level. If the price slipped below that band, the structure risked opening to deeper losses, with little immediate support until lower retracement levels near $0.067.
On the upside, the immediate barrier rested near the 50-day EMA at $0.082. Flipping that level would target resistance at the 61.8% Fibonacci retracement, positioned around $0.082. Beyond that, the token faced a stronger ceiling near $0.089. This coincided with the 0.786 retracement and marked a key rejection point in Aug. 2025.
The broader structure showed that XDC price had been consolidating between the $0.077 pivot and the $0.088 ceiling. Traders watched this range closely, as a decisive move in either direction promised to set the tone for September’s performance. Until then, the project’s bullish cues would continue to compete with the chart’s cautious tone.