
Shiba Inu’s ecosystem has come under pressure after its Layer-2 network, Shibarium, recorded a major collapse in activity. Daily transactions fell by more than 99% within days, while the project’s burn rate slowed sharply. Together, these setbacks have raised fresh doubts about Shiba Inu’s long-term stability and left SHIB’s price vulnerable near a key support zone.
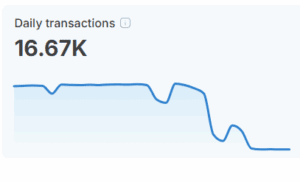
Shibarium Transactions Fall From Millions to Thousands
Shibarium was launched as a Layer-2 solution to make Shiba Inu transactions faster and cheaper. In August, the network regularly processed around 4 million transactions per day. This has made it one of the busiest chains in the ecosystem.

That momentum has now reversed. On August 23, Shibarium handled close to 4 million transactions. By August 29, activity had collapsed to just 10,000 transactions — a drop of 99.75% in less than a week. Activity edged slightly higher to 30,000 on August 30, but that still represents a collapse of more than 99% compared with early August.
The network slowdown has also hit Shiba Inu’s burn mechanism. In the last 24 hours, only 220,504 SHIB were permanently removed from circulation, an 80% decline in the burn rate. Burning is meant to reduce supply and add long-term value pressure to the token. When the rate falls this sharply, it signals reduced engagement across the ecosystem.
With both Shibarium activity and the burn rate falling together, two of the project’s core pillars — demand through transactions and supply reduction through burning — have weakened at the same time. This combination helps explain why SHIB’s price is showing little strength.
SHIB Holds Above $0.00001150 Support as Sellers Test Control
Shiba Inu is currently trading around $0.00001231, and the chart shows the token holding near an important support zone of $0.00001150 and $0.00001200. This zone has acted as a floor where buyers have stepped in several times to prevent further declines. As long as SHIB price stays above this range, the token avoids deeper downside risk.
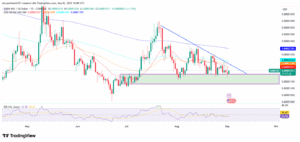
On the upside, SHIB faces hurdles at its short- and long-term moving averages. The 50-day Exponential Moving Average (EMA), which is a technical indicator that smooths out price trends over time, sits close to $0.00001280. This level has acted as a barrier in recent sessions, where sellers have been active. Beyond that, the 200-day EMA at $0.00001395 represents a stronger ceiling that SHIB would need to clear to signal a shift in momentum.
The downward blue trendline on the chart also shows that SHIB has been under pressure since late August. Breaking above this line would be the first sign that bearish control is weakening. Until then, the trend remains tilted to the downside.
RSI at 46 Shows Neutral Momentum, Breakdown Risks Remain
Momentum indicators are also pointing to indecision. The Relative Strength Index (RSI), a tool that measures whether an asset is overbought or oversold, is sitting near 46. Readings below 50 suggest that sellers have the upper hand, but the value is not low enough to show extreme weakness. This means SHIB is in a neutral zone, with no strong buying or selling momentum dominating at the moment.
If Shiba Inu manages to hold above its support around $0.00001150 and push past the descending trendline, it could build momentum toward $0.00001280, and potentially $0.00001395. Clearing both levels would be a sign of recovery. This could possibly open the path toward $0.00001500 in the short term. However, if the SHIB price fails to stay above the support zone, it risks slipping back toward $0.00001050, which would signal deeper weakness and extend the current downtrend.