
Institutional investors moved out of Hedera in recent trading sessions. Reports show over 110 million HBAR tokens sold between August 31 and September 1. The activity reflected portfolio rebalancing as funds adjusted exposure to digital assets.
Analysts noted that large transactions took place during after-hours trading, suggesting planned moves rather than retail-driven selloffs.

Whale Wallets Show Confidence
At the same time, on-chain data highlights accumulation by whale wallets. Addresses holding more than 10 million HBAR grew 71% over the past year. This rise points to confidence among large holders despite recent institutional selling. Observers link this behavior to Hedera’s partnerships with companies like Google, IBM, and Boeing, which continue to provide long-term credibility.
Technical signals suggest Hedera is consolidating rather than weakening. The relative strength index (RSI) remains near 42, showing neutral but stable momentum. In addition, HBAR trades close to the lower Bollinger Band around $0.22, often a marker of short-term oversold conditions. Market trackers state that such positions can precede a period of stabilization.
Analysts continue to place Hedera among undervalued, utility-driven tokens. Unlike speculative assets, Hedera maintains strong institutional adoption and ongoing development. Industry watchers stress that its role in enterprise and real-world applications distinguishes it from many other networks.

Falling Wedge Pattern Signals Potential Breakout
The HBAR/USD chart on September 2, 2025, shows the creation of a falling wedge pattern. A falling wedge pattern forms when price makes lower highs and lower lows within converging trendlines, usually pointing to a bullish reversal once confirmed.
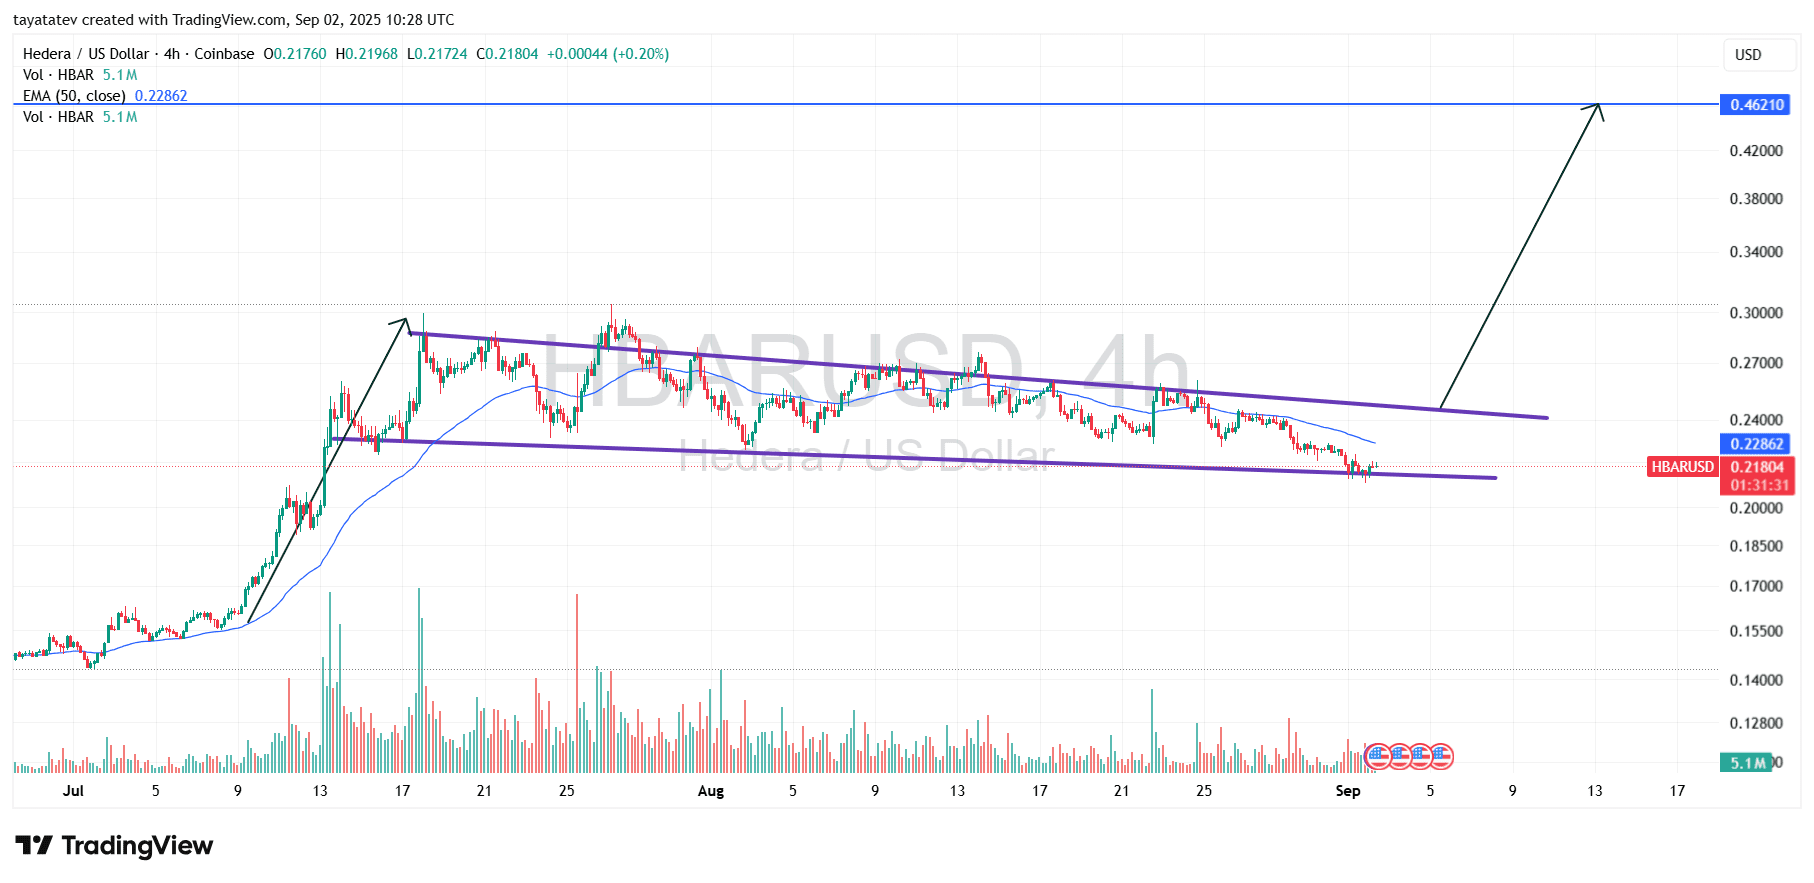
HBAR trades around $0.218 while the pattern extends across late July to early September. The lower boundary of the wedge acts as strong support, and the upper boundary compresses selling pressure. With the 50-EMA near $0.228, the price remains close to a breakout zone.
If the wedge confirms, the projected upside move points to a target of $0.462. That level equals a potential gain of 112 percent from the current price. The breakout projection aligns with measured-move expectations based on the wedge’s height.
Technical signals add weight to this view. Oversold RSI conditions and trading near the lower Bollinger Band suggest downside exhaustion. Together with consistent whale accumulation in recent weeks, the wedge structure strengthens the case for a reversal.
This setup shows Hedera may shift from a period of consolidation toward renewed momentum, with the wedge’s confirmation acting as the decisive trigger.
RSI Points to Oversold Pressure on Hedera
The HBAR relative strength index (RSI) chart dated September 2, 2025, shows momentum hovering near 39. An RSI reading below 40 usually signals oversold pressure, which often precedes a potential rebound.
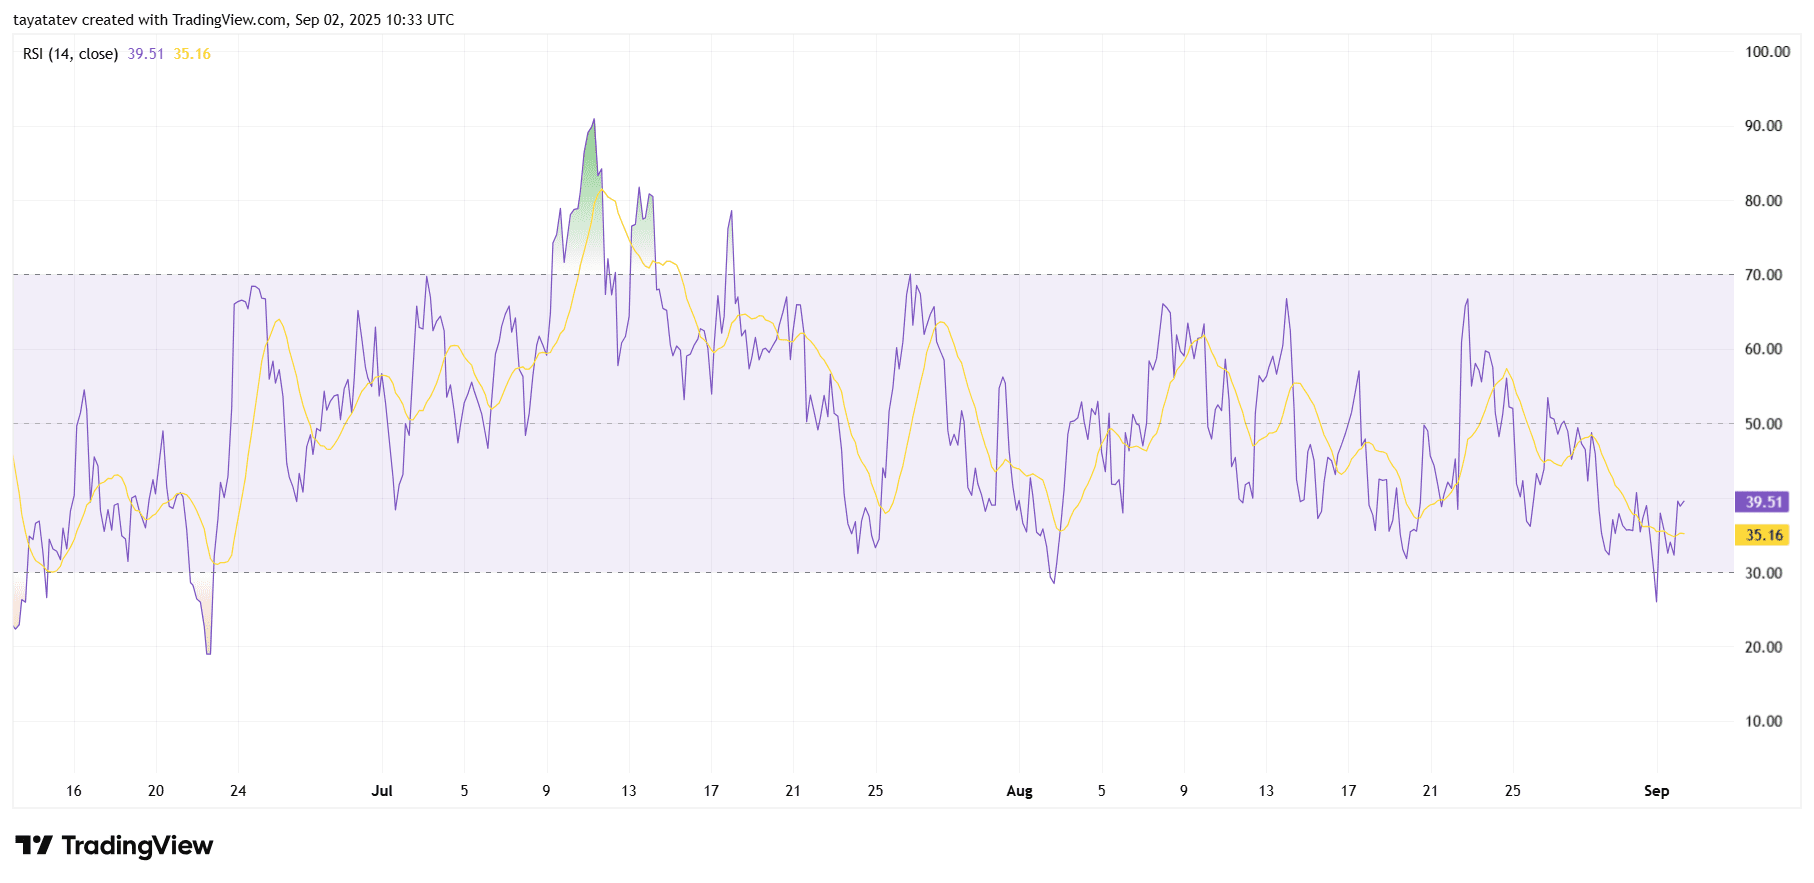
Throughout July and August, RSI values fluctuated between 30 and 70, reflecting alternating momentum swings. However, the latest trend leans closer to the lower band, highlighting weakening strength. The short-term dip to nearly 30 underscored selling intensity before a mild recovery.
With the RSI rebounding slightly from oversold territory, Hedera may be preparing for a stabilization phase. If momentum holds above 35 and climbs further, it would confirm waning downside pressure. In combination with the falling wedge setup, the RSI reading strengthens the case for a reversal once buying volume re-enters the market.