
ETHZilla Corporation has announced plans to deploy $100 million in Ether into EtherFi, a leading liquid restaking protocol. The move represents ETHZilla’s first large-scale foray into decentralized finance, signaling a shift in how institutions approach Ethereum’s staking infrastructure. With holdings of about 102,246 ETH—valued at roughly $456 million—the company now positions itself as a central participant in Ethereum’s expanding restaking ecosystem.

Executives confirmed that this allocation will not only diversify ETHZilla’s treasury strategy but also support Ethereum’s network security. By committing capital to EtherFi, ETHZilla aims to secure additional staking rewards while maintaining liquidity, an advantage that traditional staking often lacks.

Restaking Gains Momentum Across Ethereum
EtherFi operates within Ethereum’s broader restaking landscape, which has drawn increased attention from institutions and DeFi protocols alike. Restaking allows ETH holders to reinforce Ethereum’s validator set while simultaneously generating new yield streams. This dual benefit strengthens network resilience and incentivizes participation at scale.
With ETHZilla’s investment, EtherFi is expected to expand its market presence. Analysts note that such institutional involvement adds credibility to restaking and could accelerate adoption among other treasury managers. Ethereum developers also view liquid restaking as a way to distribute network security more evenly while lowering barriers for participation.
Strategic Shift Reflects Confidence in Ethereum
ETHZilla’s deployment underscores growing confidence in Ethereum’s role beyond a transactional platform. The network’s recent technical upgrades, including Dencun and Pectra, have improved scalability and reduced transaction costs. These changes make Ethereum more attractive for both institutional finance and DeFi innovation.

By entering EtherFi, ETHZilla demonstrates that institutional capital increasingly views Ethereum as a foundation for yield generation and network reinforcement. This approach reflects a wider trend of enterprises moving beyond simple ETH custody toward active engagement in Ethereum’s economic and security layers.
Ethereum Rising Wedge Eyes Breakout Toward $6,756
Ethereum ETH/USD chart illustrates a rising wedge formation, a pattern where price climbs within two upward-sloping converging lines. This structure develops as higher lows form against a relatively flat resistance level, compressing price action until a breakout occurs. In Ethereum’s case, the wedge began after a strong rally in early August and has since matured into a tightening structure that often precedes a decisive move. Rising wedges frequently resolve in the direction of the prevailing trend, which in this case remains bullish.
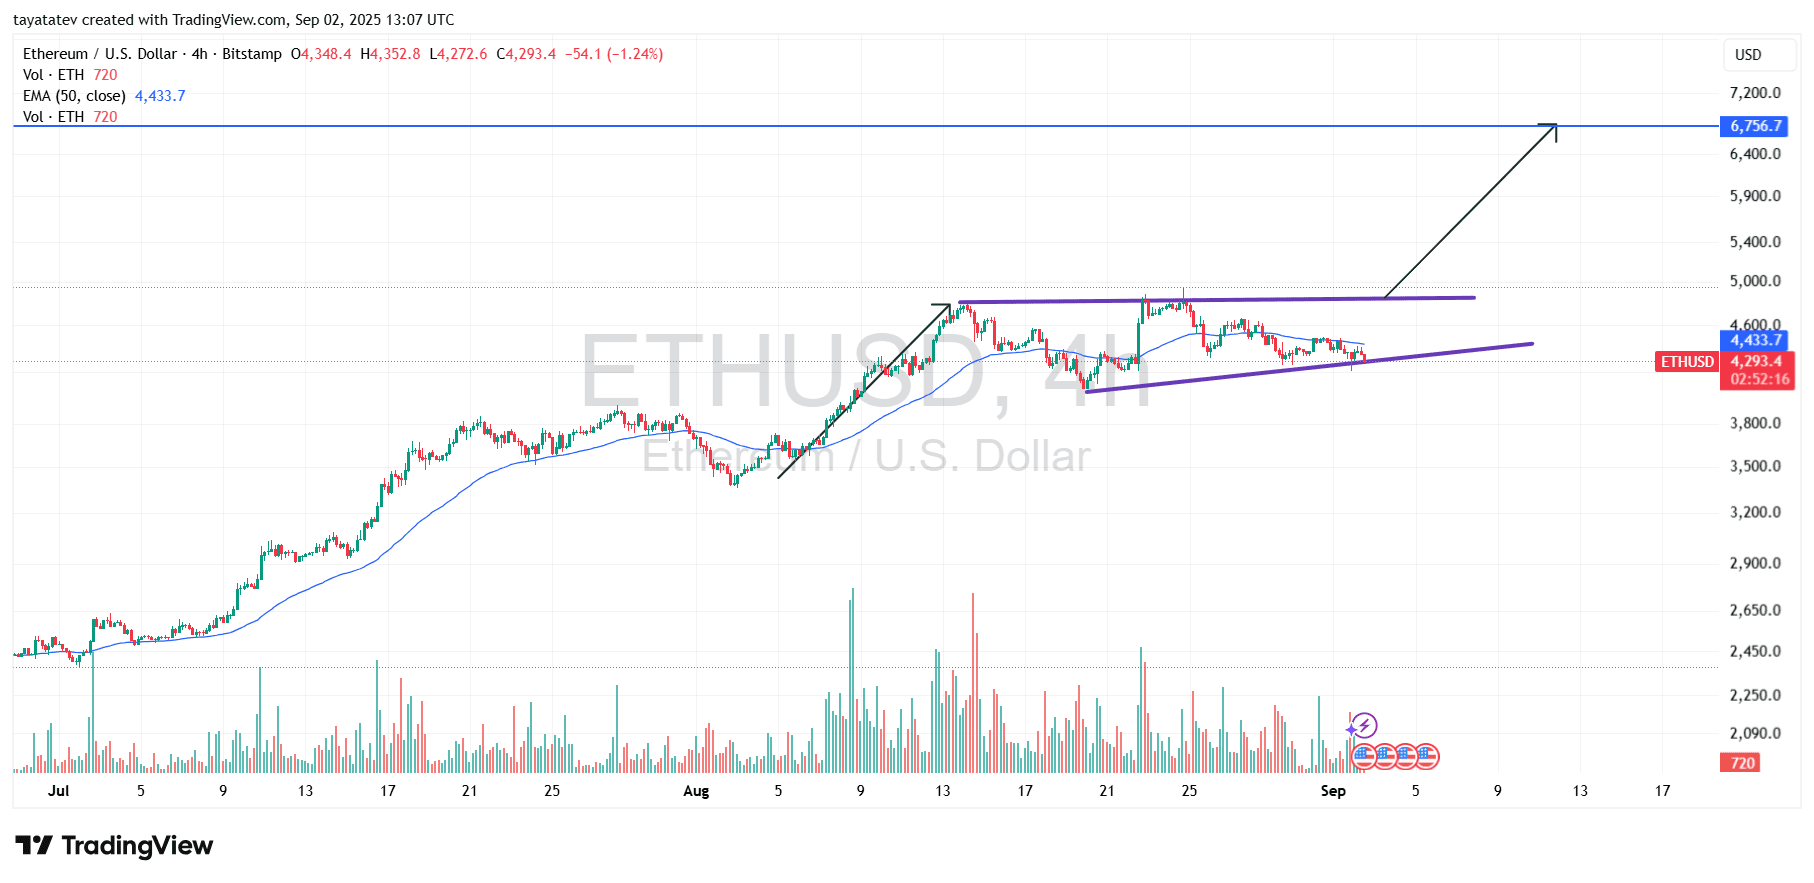
The 50-period exponential moving average, now positioned near $4,430, continues to provide a dynamic support zone. Ethereum’s ability to stay close to this line signals that buyers retain control during consolidation. At the same time, volume spikes on upward attempts indicate that accumulation is active and that market participants are preparing for higher volatility. Should the breakout confirm above the wedge’s upper boundary, the projected target extends toward $6,756. This level represents the next major resistance zone, and the chart implies that Ethereum could move from the current $4,293 range toward that objective once momentum accelerates. The combined influence of wedge structure, EMA support, and reinforcing volume builds a case for an extended advance.
Ethereum RSI Suggests Neutral-to-Bearish Momentum
Ethereum’s relative strength index on the four-hour chart currently reads 39.04, with its moving average at 45.83. The RSI has been trending below the midline of 50, signaling that bearish pressure outweighs bullish momentum in the short term. Recent attempts to move higher stalled before breaking into overbought territory, which shows that buyers have lacked the strength to sustain rallies.
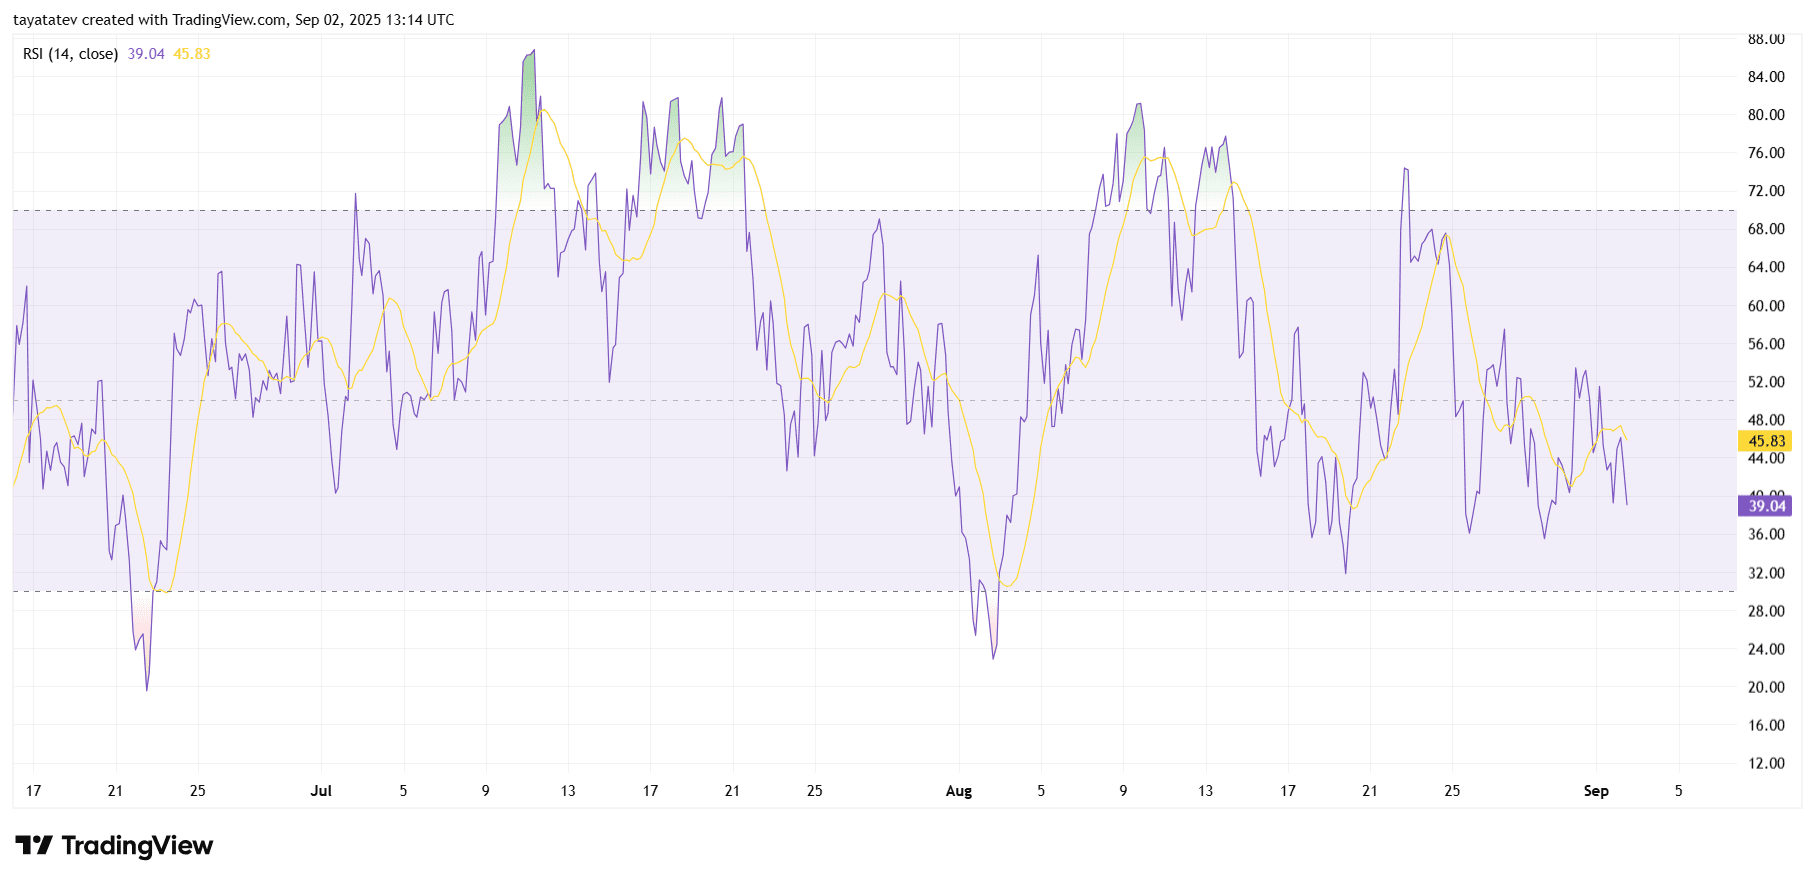
The indicator has also dipped closer to the oversold zone near 30 multiple times over the past week, but each approach has been followed by only mild recoveries. This behavior reflects indecisive demand, where buyers step in at lower levels but fail to establish dominance. Meanwhile, the RSI’s moving average remains above the actual RSI line, suggesting continued downside bias until a reversal occurs.
Taken together, Ethereum’s RSI structure implies that the market is consolidating with a tilt toward weakness. For momentum to shift, RSI would need to reclaim the 50 level and sustain upward movement while aligning with stronger volume and price action. Until then, the indicator favors caution, as pressure on support zones remains active.
Ethereum MACD Points to Weak Momentum and Bearish Pressure
Ethereum’s four-hour Moving Average Convergence Divergence (MACD) currently shows the MACD line at -31.9, the signal line at -26.9, and the histogram printing at -5.0. The MACD line sits below the signal line, and both are positioned in negative territory, which confirms that bearish momentum dominates the short-term trend. The histogram also reflects this weakness, with red bars extending below the zero line and only limited green attempts in recent sessions.
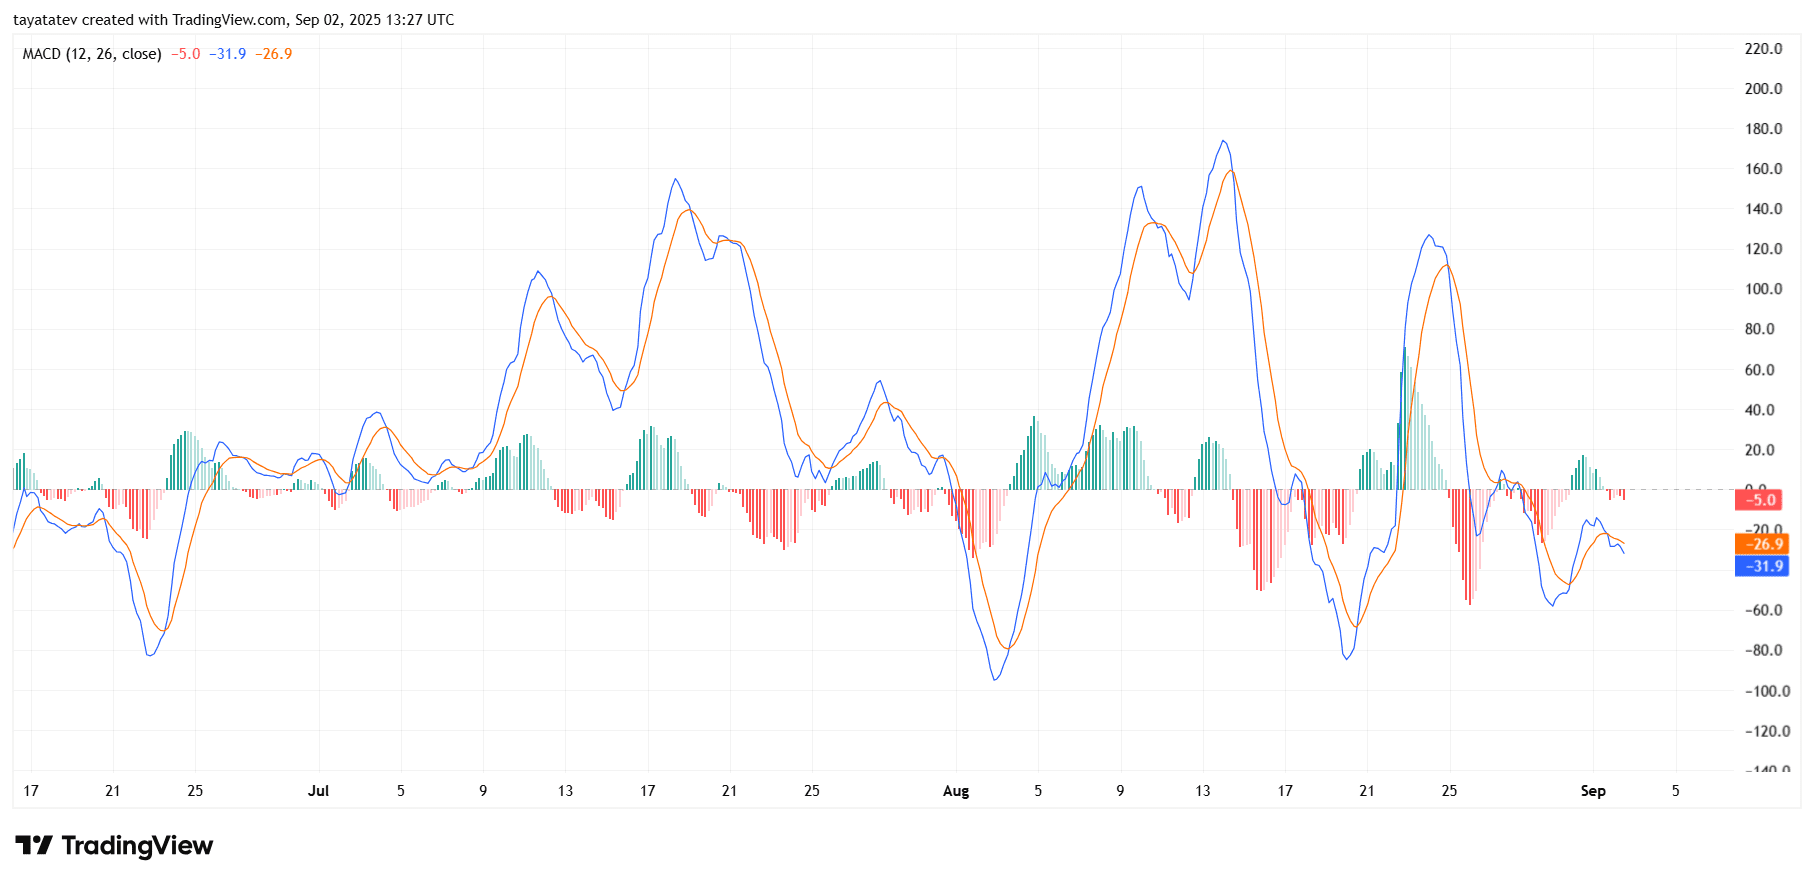
The indicator highlights that Ethereum’s bullish impulses lack strength, as every upward swing since late August has failed to sustain above the zero line. This pattern shows that sellers continue to cap rallies, and momentum has shifted toward defending resistance rather than pressing new highs. Unless the MACD line crosses above the signal line with rising histogram bars, Ethereum’s near-term bias remains tilted toward consolidation with a downward lean.
At the same time, the frequent oscillations between positive and negative territory over recent weeks indicate choppy conditions, where momentum swings quickly but lacks sustained direction. This volatility underscores uncertainty in Ethereum’s short-term path, reinforcing the need for stronger confirmation before any trend reversal.
Ethereum Balance of Power Signals Bearish Control
Ethereum’s Balance of Power (BoP) indicator on the four-hour chart currently reads -0.76, showing that sellers are exerting stronger influence over market direction. The BoP oscillates between +1 and -1, and negative values indicate that downward pressure dominates, with sellers consistently closing candles closer to their lows.
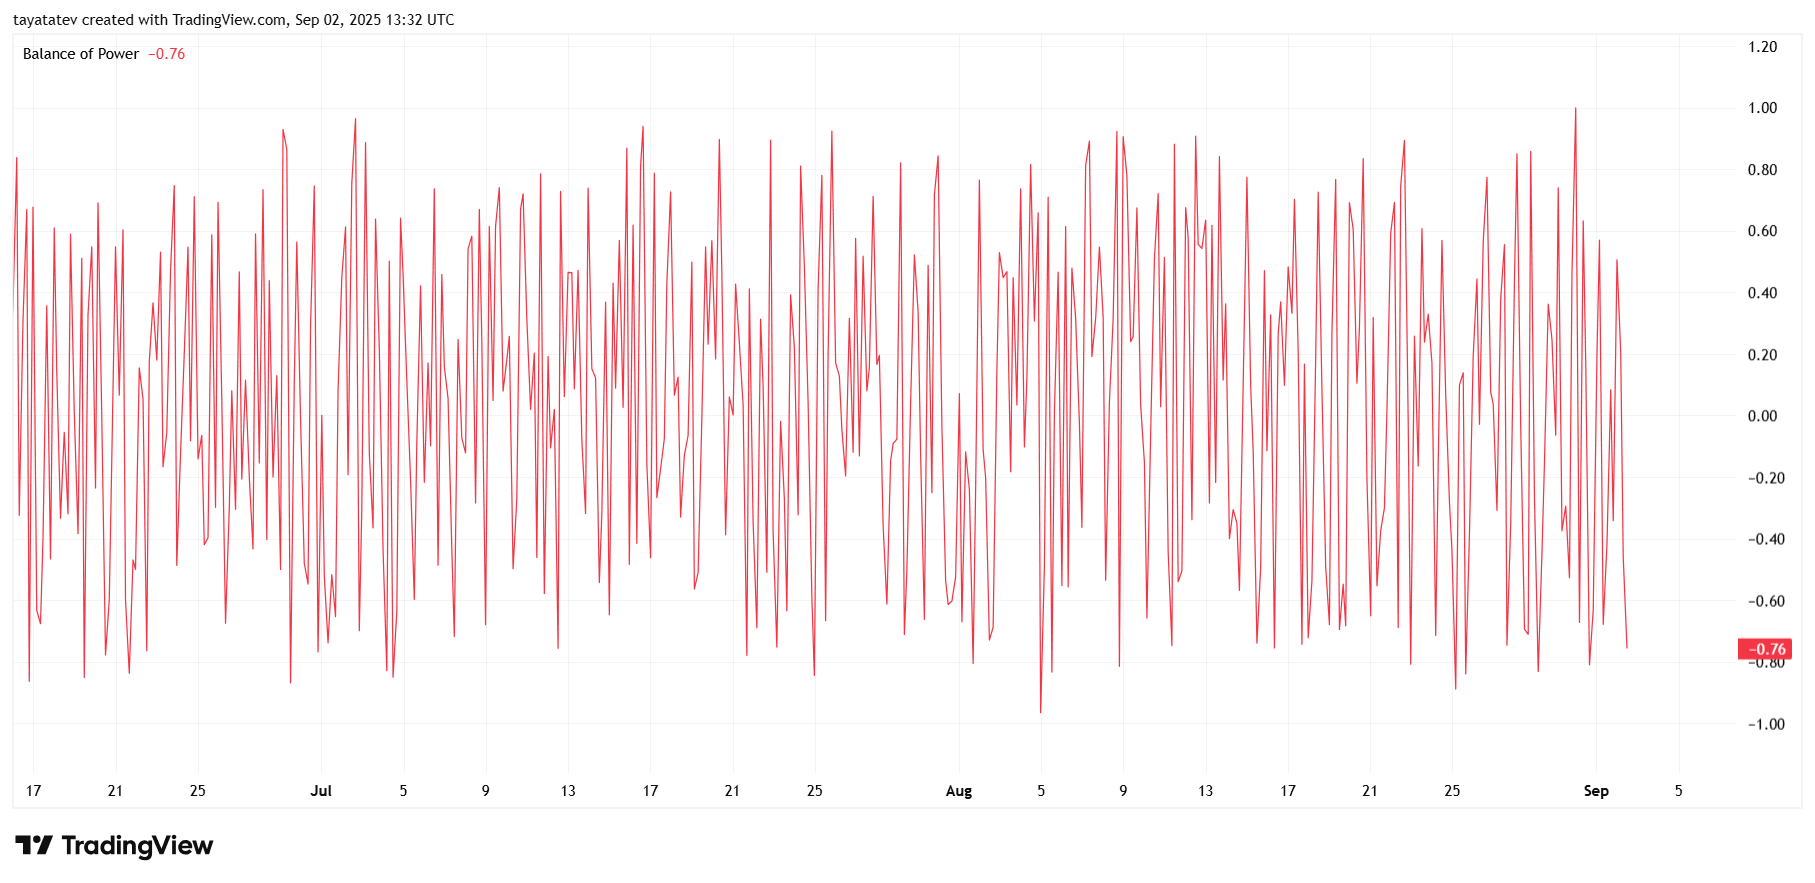
The chart also highlights frequent swings in the BoP line, reflecting volatile intraday battles between buyers and sellers. However, the latest move into deeper negative territory confirms that momentum has shifted toward the bearish side. This suggests that sellers have regained short-term control after repeated but unsuccessful attempts by buyers to maintain dominance.
When paired with recent weakness in momentum indicators such as RSI and MACD, the negative BoP reading strengthens the case for cautious outlook. Unless the BoP recovers above the zero line and sustains positive readings, Ethereum’s price action is likely to remain under pressure, with sellers retaining the upper hand.