
U.S. lawmakers are advancing the Market Structure Bill, also called the CLARITY Act, which could alter the approval path for crypto ETFs. The bill outlines a clearer division of oversight between the SEC and CFTC. Its progress adds weight to October as a pivotal month for regulatory clarity in digital assets. For XRP, the bill could ease concerns tied to its classification and strengthen its prospects in institutional markets.
The Securities and Exchange Commission is reviewing new generic listing standards for cryptocurrency-based ETFs. These standards, if approved, would allow exchanges to list certain crypto ETFs without requiring lengthy case-by-case approvals. The move could accelerate the launch of funds tied to tokens beyond Bitcoin and Ether. XRP would stand to benefit from a broader, faster ETF framework, as regulatory barriers narrow.
Meanwhile, Ripple is building infrastructure around XRP that includes the RLUSD stablecoin. Company representatives describe RLUSD and related projects as part of a framework they call the “Internet of Value.” The work expands Ripple’s activities beyond payments and introduces new financial applications connected to XRP. This approach reflects Ripple’s plan to broaden the asset’s role in digital finance.
XRP Faces Key Support Test at $2.77
Analyst Ali Martinez highlighted that XRP must stay above the $2.77 support level to avoid further losses. The 4-hour chart from Binance shows multiple reactions at this price, confirming it as a crucial floor. XRP now trades close to that threshold, raising the risk of a breakdown.
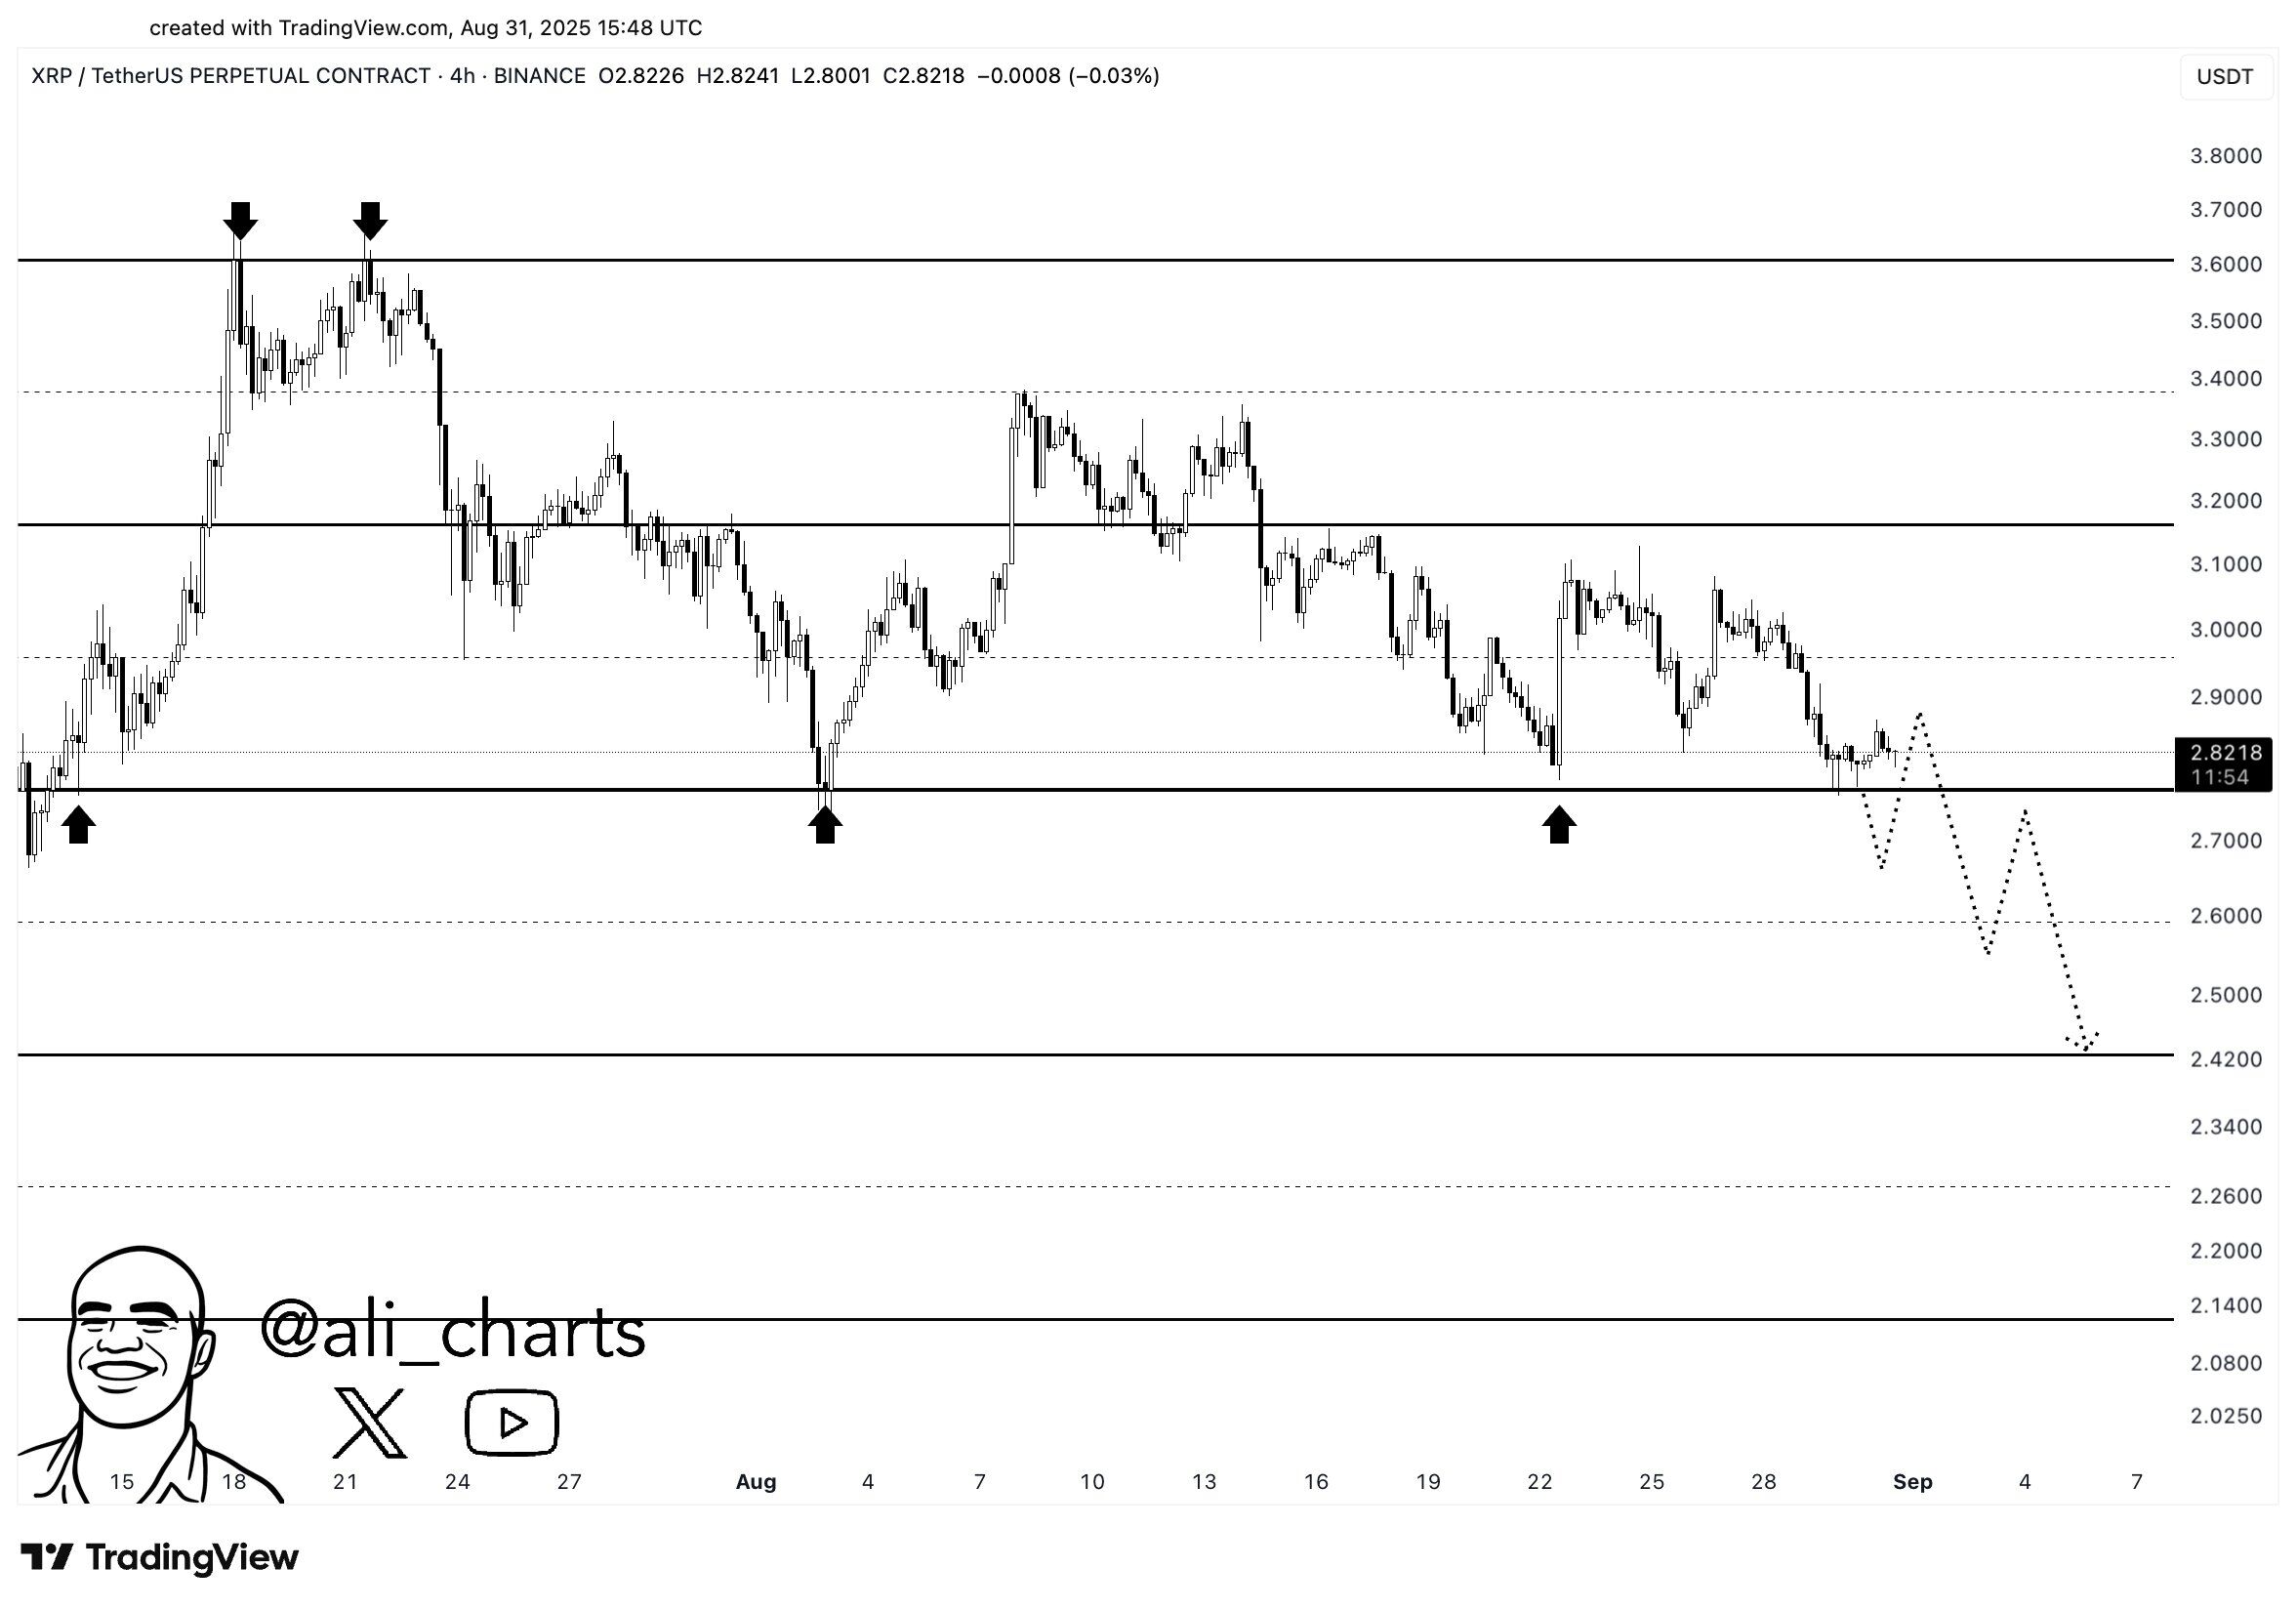
If the support fails, the analysis points to a potential retracement toward $2.40, a zone last seen in late July. The dotted projections on the chart outline a path of continued lower highs and lower lows, consistent with bearish momentum. At the same time, holding above $2.77 could stabilize XRP and delay deeper declines.

With trading volume concentrated around this zone, the next sessions are decisive. A confirmed close below support would strengthen the bearish case, while a rebound could signal renewed accumulation. The structure therefore makes $2.77 a pivotal level in XRP’s short-term outlook.
XRP Forms Bullish Flag Pattern
The chart created on Sept. 1, 2025 shows XRP trading near $2.73 after weeks inside a downward-sloping channel. The structure follows a sharp rally that peaked around mid-July, then consolidated in a parallel range. This formation aligns with a bullish flag pattern, which occurs when a strong upward move is followed by a period of consolidation that slopes slightly downward, typically signaling continuation of the prior trend.
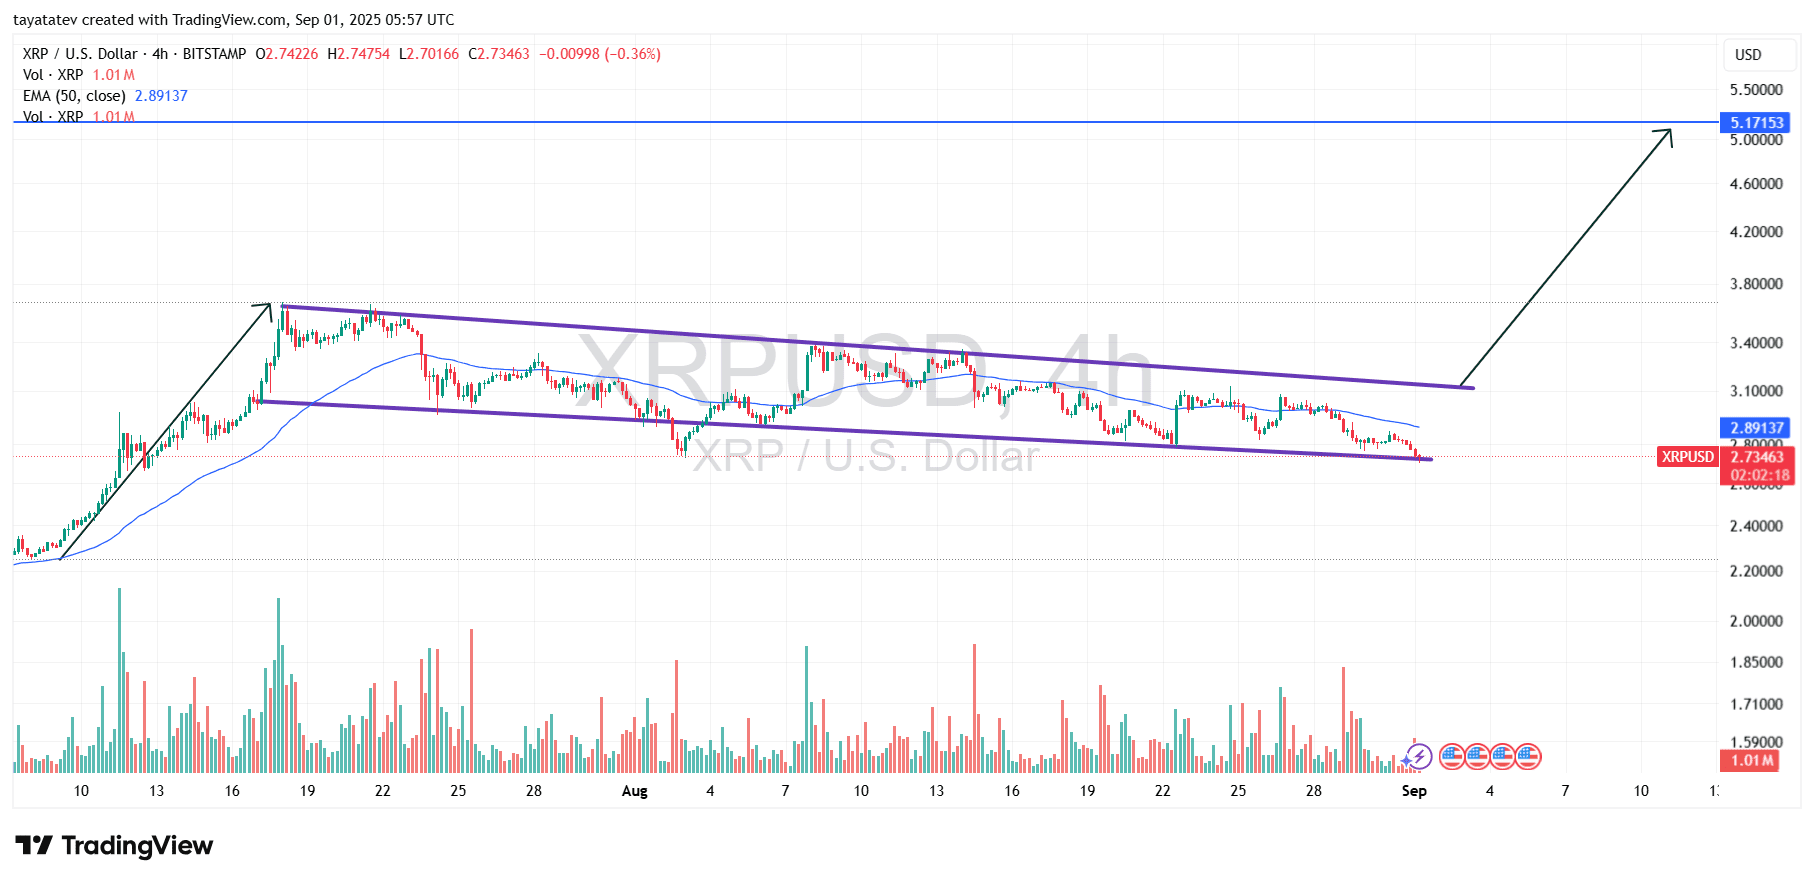
If XRP confirms this breakout by closing above the upper boundary of the channel, the measured move target points to a possible 88% increase from the current level, projecting upside toward $5.17. This target reflects the height of the initial rally added to the breakout point.
Volume analysis also supports the setup, as declining trading activity during the consolidation aligns with classic flag behavior. Moreover, XRP trades below the 50-EMA at $2.89, meaning a reclaim of this level could serve as early confirmation of momentum shifting back upward. With the pattern intact, XRP holds potential for a significant rally once breakout confirmation occurs.
XRP RSI Analysis – Sept. 1, 2025
The XRP 4-hour Relative Strength Index (RSI) chart created on September 1, 2025 shows the RSI at 27.33, with the signal line around 35.48. The reading below 30 places XRP in oversold territory, which signals that sellers have dominated the market over recent sessions.
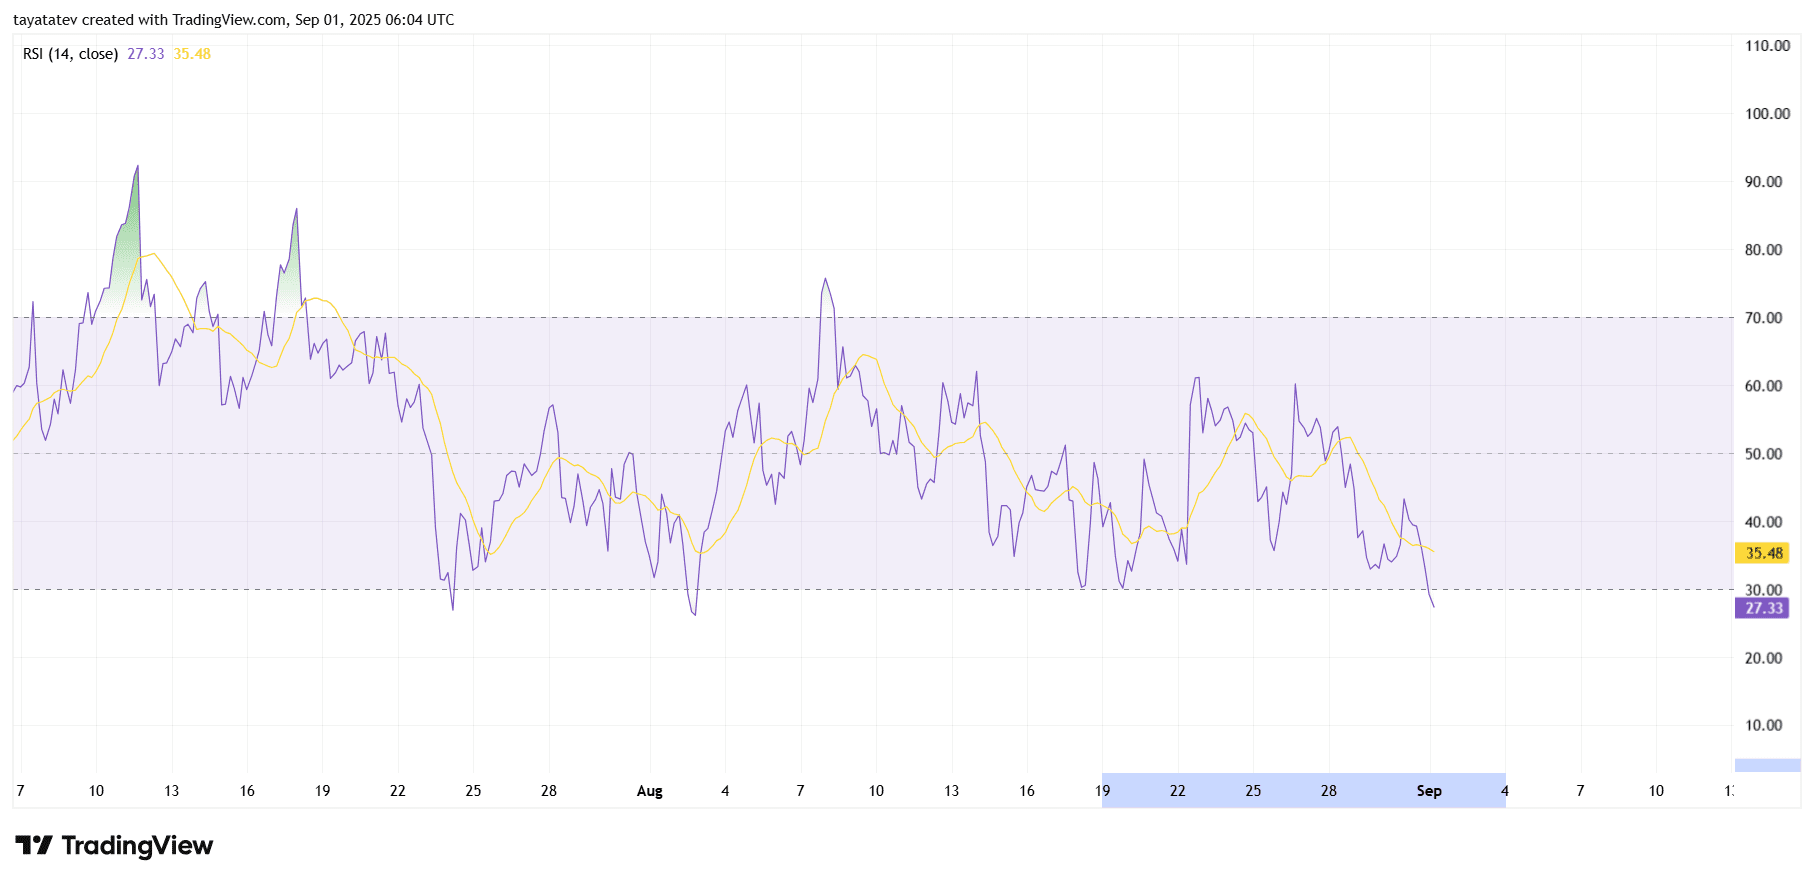
The RSI has consistently moved lower through late August, and the current dip suggests strong bearish momentum. However, since the RSI is already deep in oversold levels, it also increases the probability of a technical rebound if buying pressure emerges. Historically, when XRP’s RSI has fallen into the 25–30 range, it has often been followed by short-term corrective rallies.
At the same time, the moving average of RSI at 35.48 indicates that momentum has remained weak for a prolonged period, reinforcing the broader consolidation pattern visible on price charts. For a reversal to gain strength, RSI would need to break back above 40 and hold.
XRP MACD Analysis – Sept. 1, 2025
The XRP 4-hour MACD chart, created on Sept. 1, 2025, shows both the MACD line (-0.04559) and the signal line (-0.03973) moving below zero. The histogram also prints slightly negative values around -0.00586, reflecting weak bearish momentum at the time of observation.
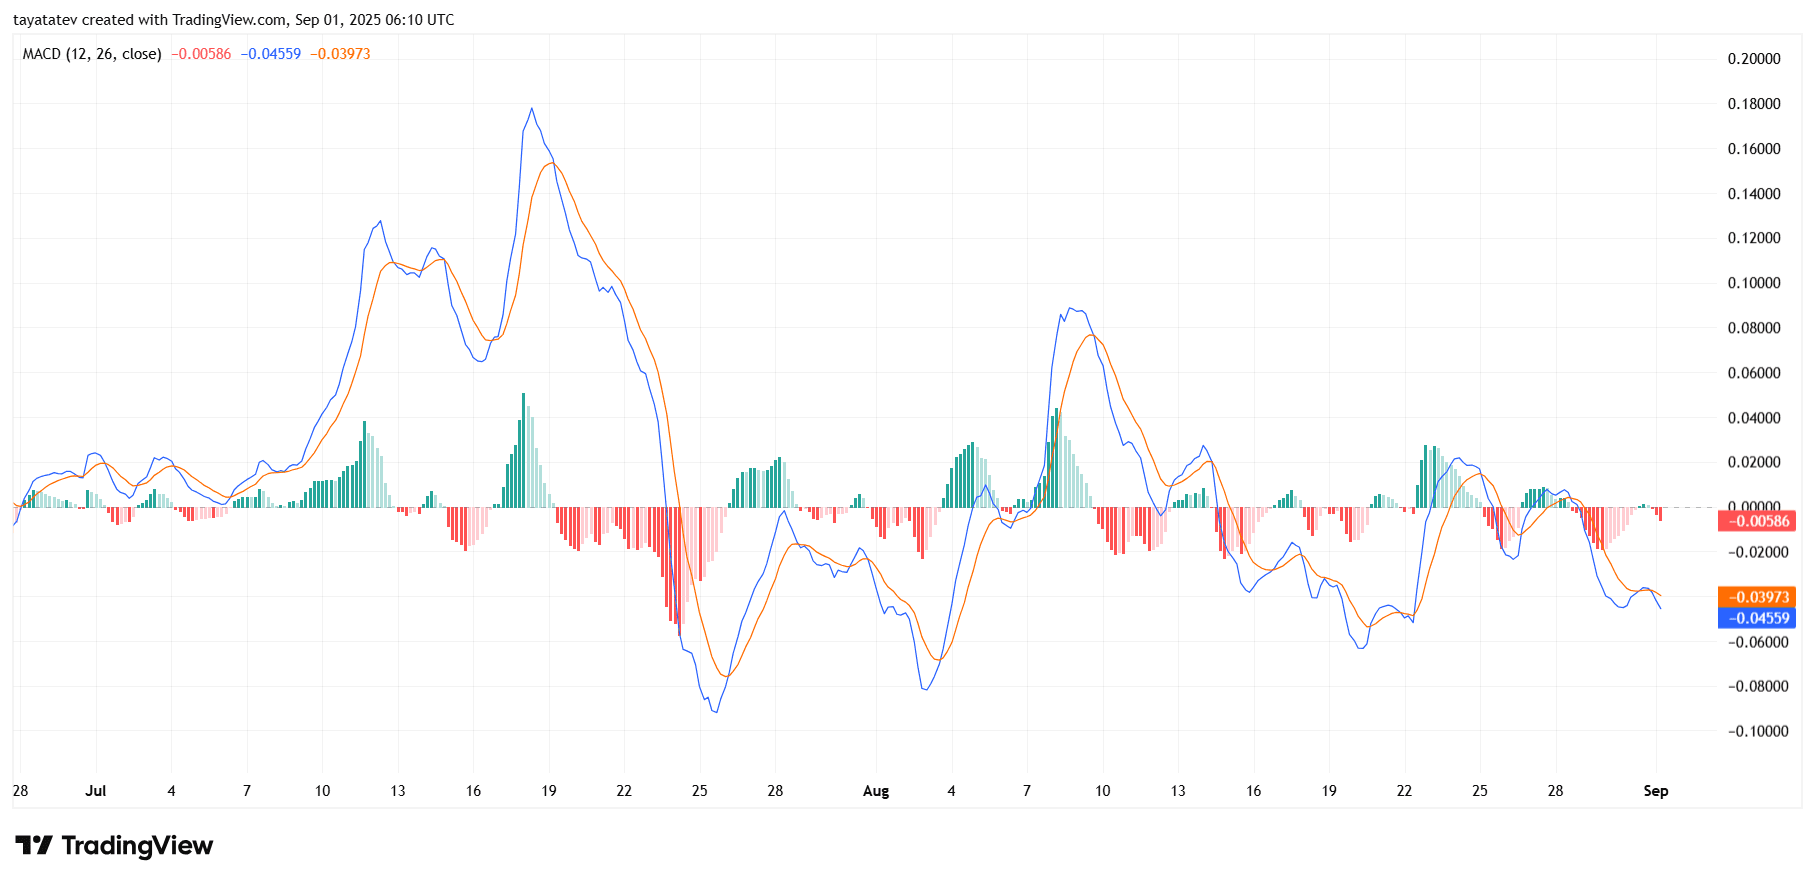
Throughout August, the MACD displayed several failed bullish crossovers, with each attempt fading before building strong upside continuation. The current alignment, with the MACD line below the signal line, confirms bearish pressure in the short term. However, the histogram’s shallow bars suggest that selling momentum is not accelerating but instead stabilizing.
This setup often precedes a potential momentum shift if buying interest increases. For a stronger bullish reversal signal, the MACD line would need to cross back above the signal line with rising histogram bars moving into positive territory. Until that happens, XRP remains in a corrective phase, with momentum tilting slightly against buyers.