 Flashes Golden Cross Against Bitcoin (BTC), Analysts …")
Solana (SOL) has formed a golden cross on its Bitcoin trading pair, identified by crypto analyst Crypto Rover. The last time this pattern appeared, Solana rallied nearly 300% against Bitcoin. A golden cross happens when a shorter-term moving average rises above a longer-term one, such as the 50-day crossing the 200-day. It is often read as a signal of strength but remains a lagging indicator. This makes confirmation from volume and derivatives activity essential.
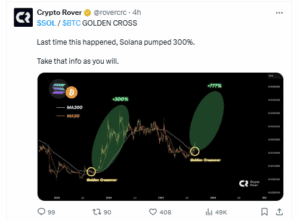
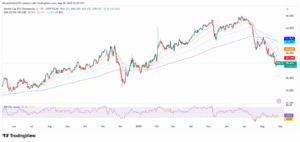
The current SOL/BTC chart shows the pair trading at 0.00189 BTC. It is holding above its 20-day, 50-day, 100-day, and 200-day moving averages. Momentum is supported by an RSI of 67, just below the overbought threshold. This suggests strong pressure, but also a risk of near-term cooling. The next resistance lies near 0.0020 BTC, while support sits around 0.0017 BTC.
$4B in Solana Accumulated Near $180 Support
Analyst Ali Martinez pointed to Solana’s breakout from a triangle pattern and reaffirmed his $300 price target, framing $176 as key support and $207 as a breakout trigger. He also flagged on-chain data showing that 18.56 million SOL, valued near $4 billion, were accumulated around $180.
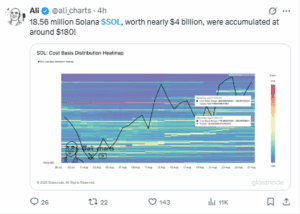
With Solana’s circulating supply at 540.67 million tokens, this cluster represents roughly 3.4% of supply concentrated in one range, reinforcing the $180 zone as a major accumulation level. Such dense positioning suggests that Solana buyers at this range may defend it aggressively, but it also means a breakdown could trigger significant realized losses.
Additionally, Coinglass liquidation data shows clusters of liquidated short positions aligning with Solana’s recent rallies. This indicates that upward moves have been amplified by forced short exits, a dynamic that can accelerate gains but also fade if open interest thins. Funding rate charts reveal that most exchanges currently show positive rates, suggesting traders are paying to hold longs. While this signals bullish positioning, excessive positive funding can lead to corrections if sentiment overheats.

Furthermore, Bitcoin dominance, which measures BTC’s share of total crypto market capitalization, has declined from above 64% earlier this year to around 58.4%.
The drop signals relative strength in altcoins. This is a condition that historically increases the impact of bullish setups such as Solana’s golden cross. If Bitcoin dominance continues to fall, Solana could benefit from stronger capital rotation into non-BTC assets.
SOL/USD Holds Above Key Averages, Eyes $220 Breakout
Solana price currently stands at $208. This is down 2% on the day with a market cap of $112.6 billion and 24-hour trading volume of $13.1 billion. The daily chart shows price above all major moving averages, with the 20-day EMA at $193.6, the 50-day at $182.6, the 100-day at $173.5, and the 200-day at $168.7. This structure confirms a strong trend foundation. The relative strength index at 58 shows balanced momentum, leaving room for an extension higher.
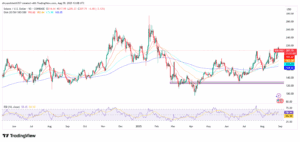
Resistance remains concentrated in the $215 to $220 range, a level repeatedly tested in recent weeks. A confirmed daily close above $220 would validate the breakout and open the path to a measured move toward $260, with intermediate resistance likely near $240. On the downside, immediate support rests at the 20-day EMA around $194. A break below that zone could expose the $183 to $174 range near the 50-day and 100-day averages. The 200-day EMA at $169 forms the final layer of trend support, while the $132 to $140 zone represents deeper historical demand.