
Zebec Network has expanded its ecosystem with the launch of the ZebecNET eSIM upgrade. This development allows users to connect across more than 70 countries and interact with over 15 blockchains through one system.
The upgrade aims to make decentralized finance more practical in everyday life by improving real-time payroll and cross-border payment accessibility.

The eSIM rollout highlights Zebec’s focus on linking blockchain with real financial use cases. By providing seamless global connectivity, the network seeks to improve user experience while making DeFi applications accessible in regions where traditional banking services are limited. The initiative also aligns with Zebec’s broader plan to build a financial infrastructure that blends digital and physical services.
Regulatory Compliance Efforts Gain Momentum
Zebec Network has also moved toward stronger compliance standards to improve institutional trust. The project has begun SOC 2 audits, a framework that evaluates how companies manage customer data, and has started working toward compliance with the European Union’s MiCA regulatory framework.
By prioritizing compliance, Zebec aims to position itself as a reliable partner for enterprises and financial institutions. These efforts are designed to provide assurance to potential partners that the network is building secure and regulated systems. This step is becoming increasingly critical as regulators worldwide tighten their oversight of digital asset service providers.
Institutional Partnerships Expand Ecosystem Utility
Alongside compliance progress, Zebec has strengthened its credibility by forming partnerships with established players in the blockchain space. Collaborations with World Mobile and Ripple mark a significant step in extending Zebec’s role within broader financial ecosystems. These partnerships are focused on real-world adoption of blockchain-based services, ranging from payment settlements to telecommunications integration.
Through these collaborations, Zebec continues to develop tools and services that bridge traditional finance and decentralized systems. The partnerships highlight Zebec’s growing ability to provide solutions that appeal to both retail users and institutional participants.
Zebec Network forms a bullish flag on the four-hour chart
Captured on August 26, 2025, the Zebec Network to Tether United States Dollar pair (ZBCN/USDT) on the OKX exchange shows a clear bullish flag structure on the four-hour timeframe. At the time of the snapshot, the price printed 0.0045996 USDT while the 50-period Exponential Moving Average (EMA; Exponential Moving Average) sat at 0.0047260. Price action has consolidated inside two downward-sloping, near-parallel lines after a sharp advance, which is typical of a flag. Volume tapered during the consolidation, and the chart annotates an expected break above the upper boundary with an objective near 0.00849.
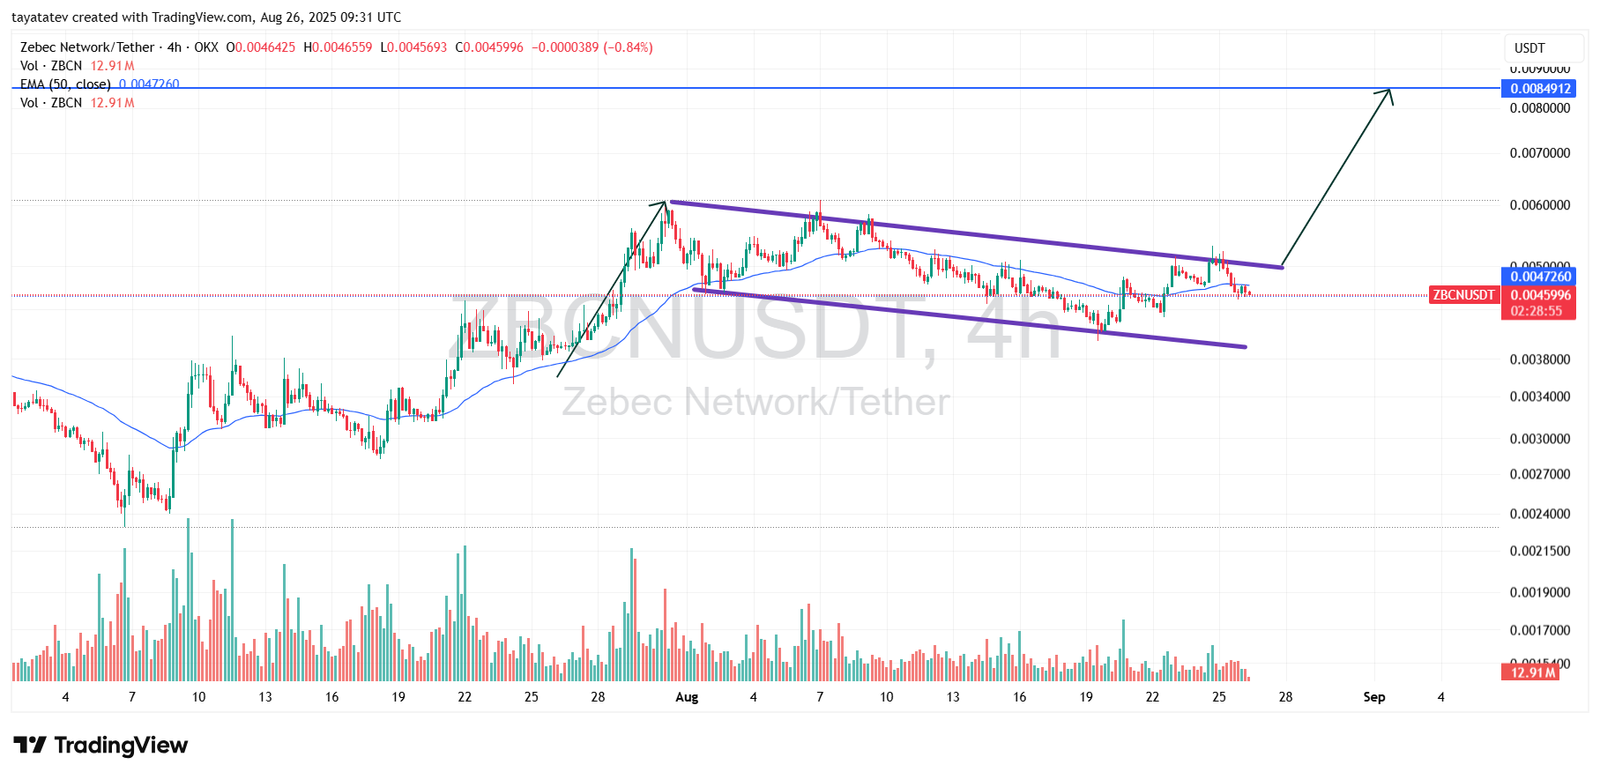
A bullish flag forms after a sharp rally creates the flagpole. Price then drifts lower inside a narrow, downward channel called the flag. Traders watch for a strong candle close above the upper boundary. Rising volume often confirms the breakout.
The projection usually matches the flagpole’s height added to the breakout point. In this case, the setup points to an eighty-five percent move from 0.0045996 USDT. The target sits near 0.008509 USDT, in line with the 0.0084912 level on the chart.
Price now compresses just below the upper boundary while holding near the 50-period Exponential Moving Average at 0.00473. A sustained four-hour close above both levels would confirm continuation. If price slips back toward 0.0038–0.0039, the pattern stays valid but unconfirmed.
The structure remains intact as long as the lower trendline holds. The chart from August 26 shows a bullish flag pointing to 0.00851 USDT, with confirmation still dependent on a breakout and higher participation.
Zebec Network Stochastic Momentum Indicator Analysis
The chart dated August 26, 2025, shows the Stochastic Momentum Indicator (SMI) for Zebec Network (ZBCN/USDT) on the four-hour timeframe. The SMI line reads –71.62, while the signal line is –66.45. Both sit deep in the oversold region, which highlights strong selling momentum.
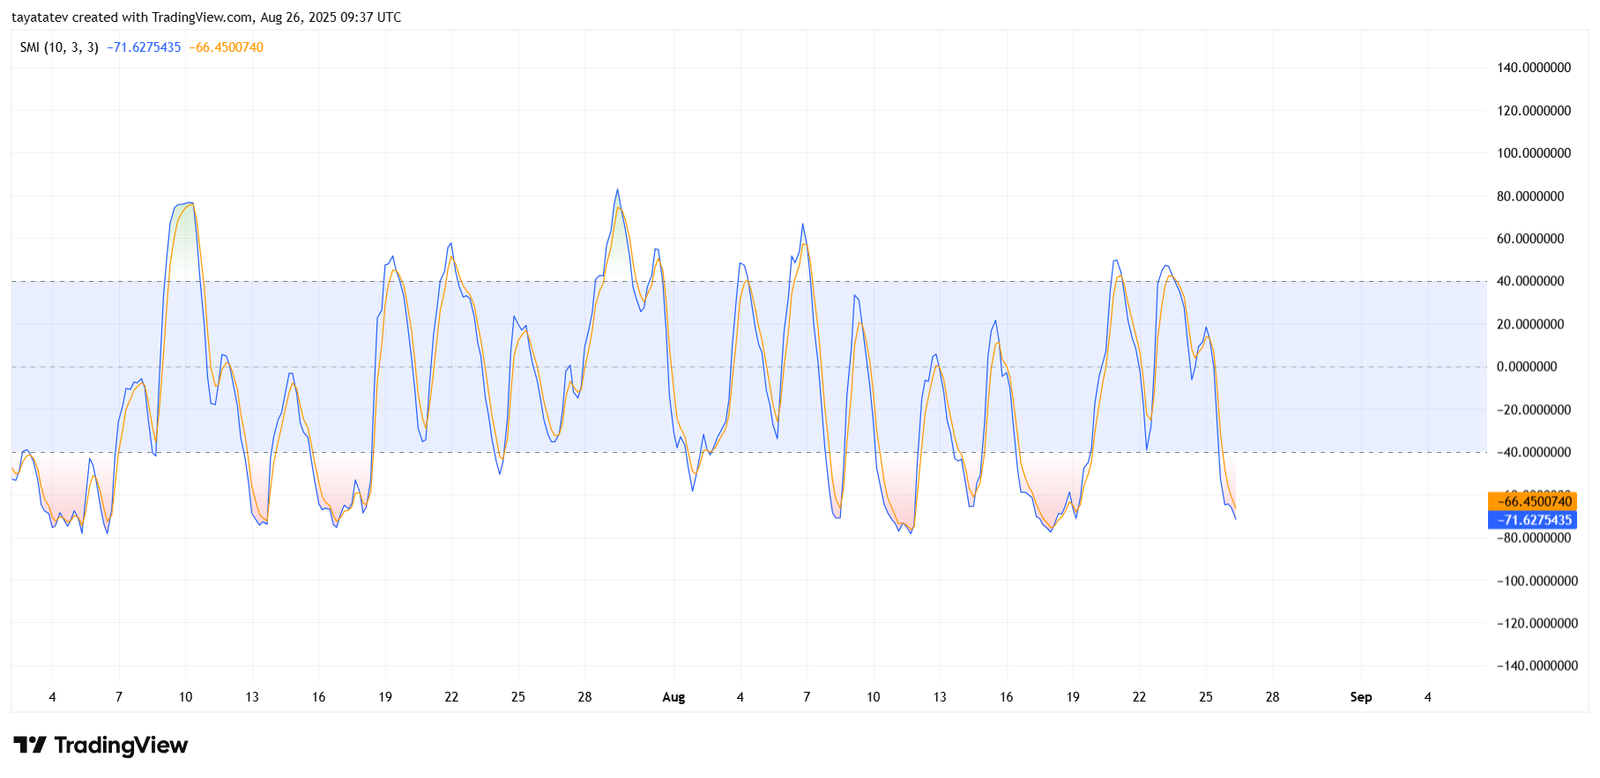
The SMI measures how the current closing price compares to the midpoint of the recent range. Readings below –40 are considered oversold. The present values far below that level suggest that sellers may be running out of strength. Oversold conditions often create the setup for a rebound if momentum shifts.
The two lines are moving close together, which raises the chance of a crossover. If the SMI line crosses above the signal line while still in the oversold region, it would confirm a bullish reversal. Such a signal would strengthen the bullish flag breakout scenario seen on the price chart.
Downside pressure remains until the crossover takes place. However, with SMI readings this low, the risk of further decline is smaller compared to the potential upside. The indicator therefore supports the case for a possible rally once confirmation appears.
Zebec Network Relative Strength Index Analysis
The chart from August 26, 2025, shows the 14-period Relative Strength Index (RSI) for Zebec Network on the four-hour timeframe. The RSI reads 41.48, while its moving average is at 53.08.
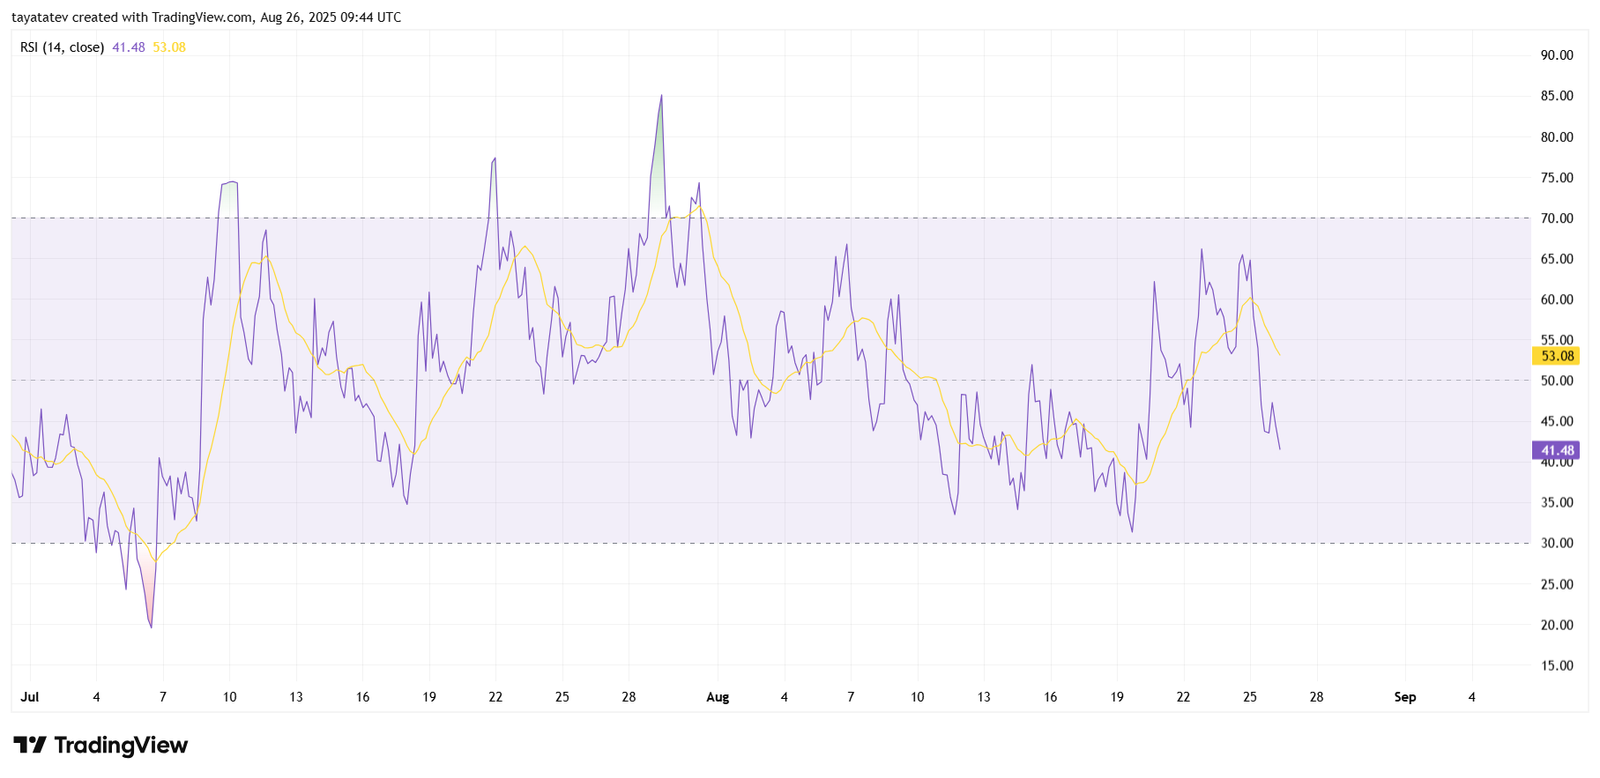
The Relative Strength Index tracks momentum by comparing gains and losses. Values above 70 mark overbought zones. Values below 30 mark oversold conditions. At 41, the RSI sits in the lower neutral range. This level signals weak momentum but not yet oversold.
The indicator has dropped from the mid-50s to the low 40s. This move shows that sellers currently control short-term momentum. The distance from the moving average confirms bearish pressure.
If the RSI turns up and moves above its average, momentum could shift back to buyers. If the decline continues, the RSI may approach 30. A move that low would indicate an oversold condition and possible rebound.
For now, the RSI highlights soft momentum. Sellers remain active, but downside limits grow as the indicator nears oversold territory.