
On June 30, 2025, Shiba Inu (SHIB/USD) created a bullish flag pattern on the daily chart. The price had previously moved up sharply, forming a vertical rally known as the flagpole. After that, SHIB entered a period of consolidation inside two downward-sloping, parallel red trendlines. This shaped the flag portion of the pattern. A bullish flag reflects a temporary pause or correction in an overall upward trend, often ending with a breakout to the upside once the pattern is complete.
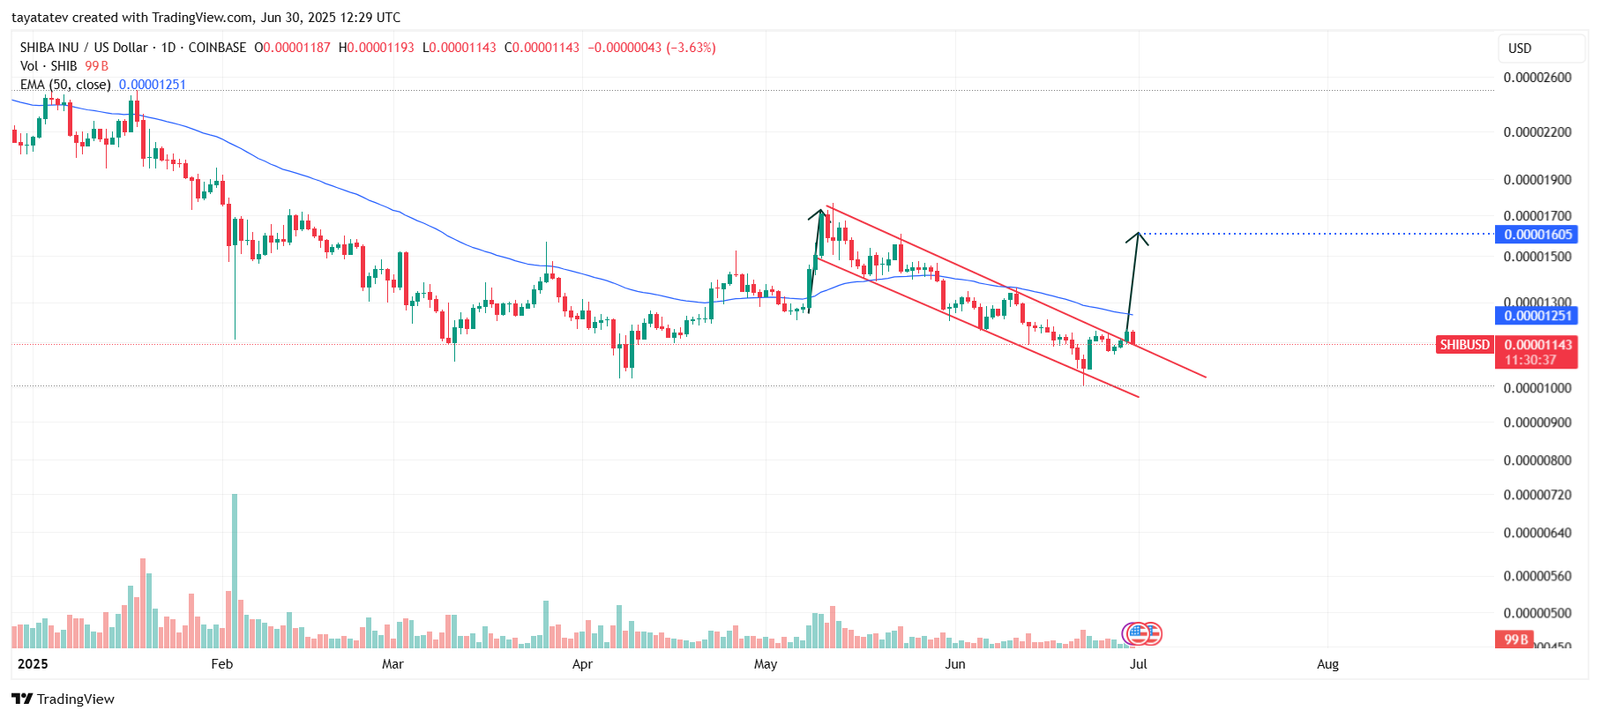
In this case, the breakout happened clearly. SHIB pushed above the upper red trendline and crossed the 50-day Exponential Moving Average, which sits at $0.00001251. That upward break confirmed the pattern. The breakout also came with rising volume, which adds strength to the signal.
A bullish flag usually resolves by continuing in the direction of the initial move. If this breakout holds, the price could climb around 40 percent from its current level of $0.00001143. That would place the next target near $0.00001605, the same level as the previous local peak before the flag formed.
The measured move method supports this view. It takes the height of the initial rally and applies it from the breakout level. In this setup, that gives a projected move from just above the breakout zone toward the $0.00001605 region. SHIB had already reached that zone during the May rally before it corrected lower.
Now that SHIB has broken above both the flag resistance and the 50 EMA, buyers appear to be regaining control. If daily candles continue closing above these levels, the pattern remains active. As long as the breakout stays intact and volume doesn’t drop sharply, SHIB may continue its path toward the projected resistance near $0.00001605.
RSI Shows Recovery but Still Below Neutral Zone
As of June 30, 2025, the Relative Strength Index (RSI) for SHIB stands at 42.92, with its moving average at 38.40. The RSI is a momentum indicator that shows whether a coin is overbought or oversold. A reading above 70 signals overbought conditions, while below 30 means the asset is oversold. The midpoint at 50 usually separates bullish momentum from bearish.
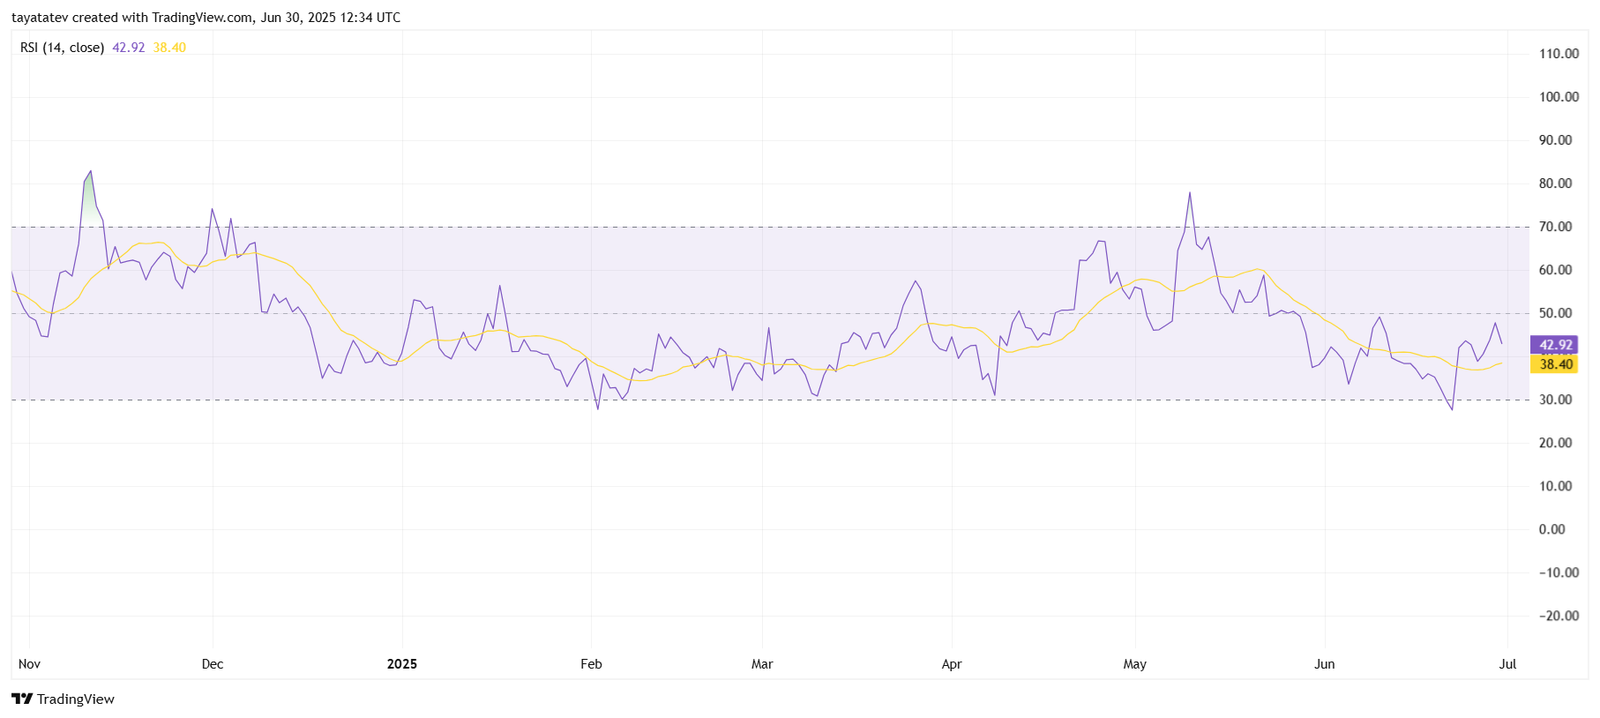
SHIB’s RSI recently bounced from near 30, which is close to the oversold threshold. This bounce signals that bearish momentum may be slowing down. The RSI line has also moved above its own 14-day moving average, showing early signs of short-term strength.
However, the RSI remains under the 50 level. That means SHIB has not yet entered full bullish momentum. To confirm strong upward strength, the RSI needs to break and stay above 50. Until then, traders may treat this as a recovery phase rather than a complete trend reversal.
The RSI movement supports what the price chart already shows: SHIB broke out of a bullish flag pattern, and momentum is improving. If the RSI keeps rising along with the price, that could add more confirmation to the breakout.
Balance of Power Turns Bearish Despite Breakout
Meanwwhile, the Balance of Power (BoP) indicator for SHIB showed a sharp drop to -0.87, signaling that sellers currently hold stronger control over price action. The BoP measures the strength of buyers versus sellers by comparing the closing price relative to the price range of a given period. A positive value means buyers are dominating, while a negative value reflects seller pressure.
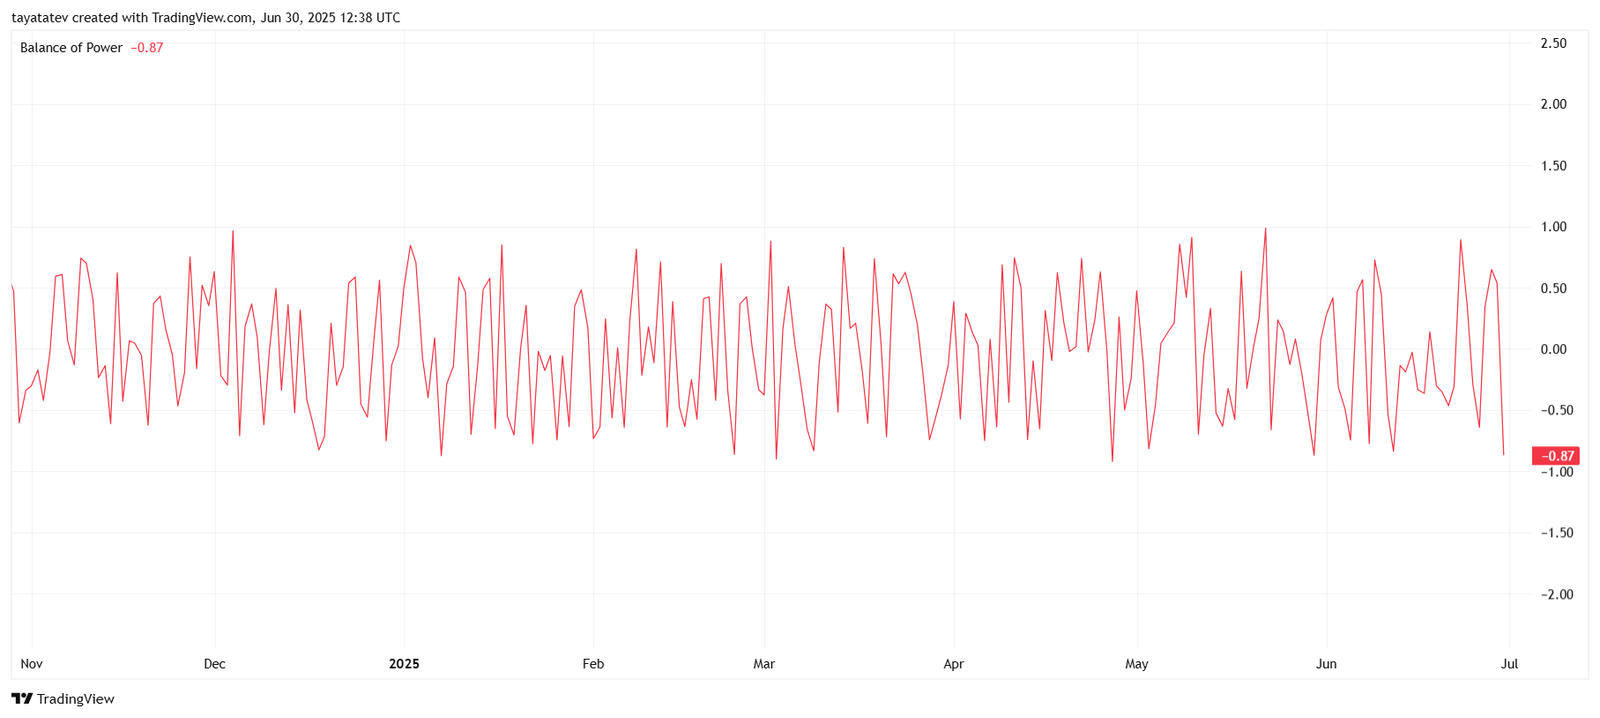
Throughout the past few months, SHIB’s BoP has stayed volatile, with frequent swings above and below the neutral zero line. This indicates that market sentiment has remained unstable, without a clear long-term direction. Most of the time, the indicator failed to sustain any trend above 0.5, suggesting weak buyer conviction even during price rallies.
Now, despite the bullish flag breakout seen in the price chart, the BoP dipping into deeper negative territory shows that bears have not fully stepped back. This drop conflicts with the bullish momentum signaled by the price action and RSI. Such divergence often hints at caution, as it shows that the breakout might still face resistance from selling pressure.
Until the BoP crosses above the neutral line and stays there, the strength of the ongoing breakout may remain limited. However, if SHIB’s price continues rising with higher volume, the BoP could shift back in favor of buyers and confirm broader trend strength.
Directional Indicator Shows Bulls Regaining Momentum
On June 30, 2025, the Directional Movement Index (DMI) for SHIB showed signs of improving bullish strength. The DMI includes three lines: the +DI (orange), the -DI (blue), and the ADX (pink). The +DI measures buyer strength, the -DI shows seller strength, and the ADX tracks the overall trend strength, regardless of direction.
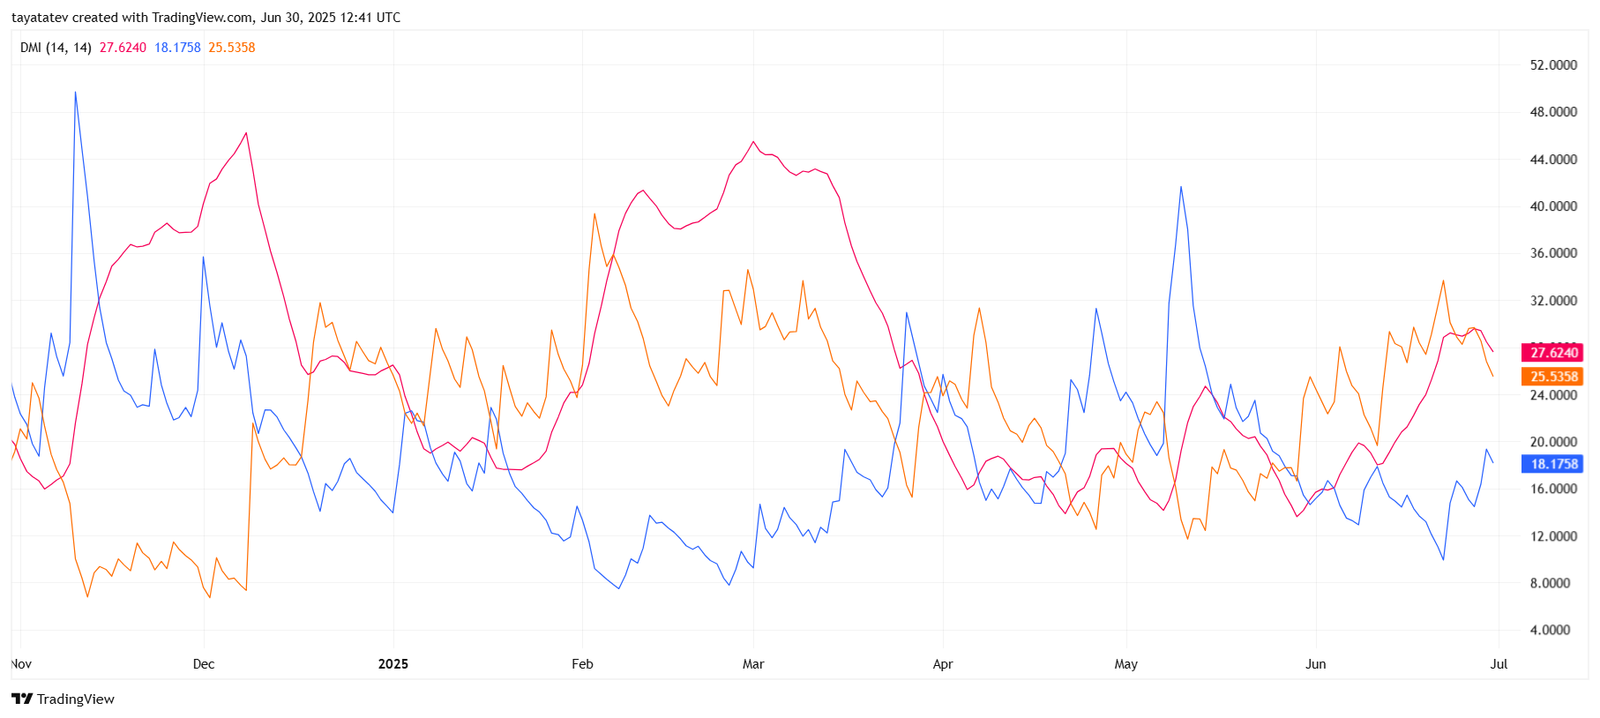
Currently, the +DI is at 25.53, slightly below the -DI at 27.62, which indicates that bears still hold a marginal advantage. However, the gap has narrowed. Over the past few days, the +DI has moved up while the -DI has started to flatten, hinting at a shift in momentum toward buyers.
Meanwhile, the ADX stands at 18.17, which suggests a weak trend. For a strong directional move, the ADX typically needs to rise above 25. Despite this, the rising slope of the ADX signals that trend strength could be building. The last time the ADX moved up while the +DI was climbing, SHIB saw a rally.
This DMI setup supports the early breakout seen on the price chart. While sellers still maintain slight control, the upward movement of the +DI and ADX may indicate that buyers are preparing to take over. If the +DI crosses above the -DI and the ADX continues rising, it would confirm growing trend strength in favor of bulls.