
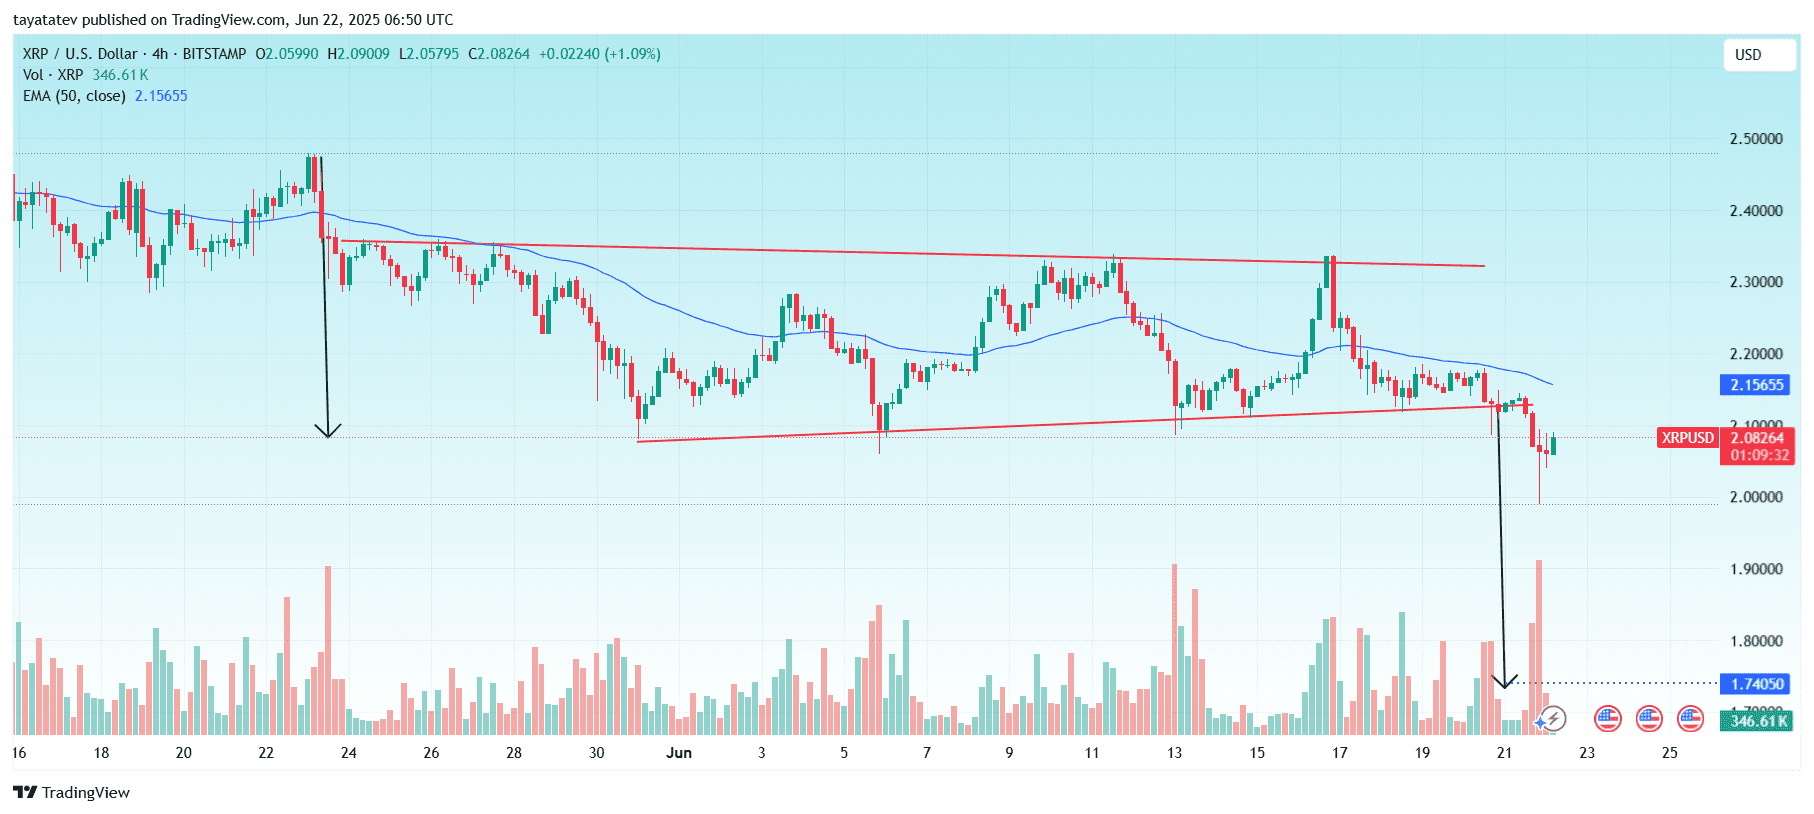
XRP formed a bearish pennant pattern between May 23 and June 21, 2025. The structure became clear on the 4-hour chart, where XRP traded inside a narrowing triangle after a sharp drop. On June 21, XRP broke down from this pennant, confirming the bearish continuation.
A bearish pennant is a continuation pattern. It forms after a steep downward move known as the “flagpole.” The price then consolidates between converging trendlines, creating a small symmetrical triangle. Once the pattern completes, a breakdown often leads to another strong move lower, typically equal to the height of the flagpole.
XRP Already Breaking Below the Pennant
The height of the flagpole is approximately 20%, from around $2.45 to $2.00. After consolidating for nearly four weeks inside the pennant, XRP broke below the lower trendline on June 21 with rising volume, confirming the pattern.
As of June 22, XRP trades at $2.08. It has already moved about 6.5% below the pattern support. If the bearish pennant fully plays out, XRP may fall another 13.5%–15%, targeting the $1.70–$1.75 range.
Further Breakdown Remains Possible
Volume surged during the breakout, supporting the continuation scenario. The 50 EMA at $2.15 also flipped into resistance, adding more bearish pressure. If XRP stays below this moving average and fails to reclaim the lower trendline near $2.10, selling may continue.
Moreover, the next high-volume support lies near $1.74, shown on the chart. This area also matches the projected 20% decline from the breakout point.
In short, XRP confirmed a bearish pennant pattern with its breakdown on June 21. Unless it quickly reclaims the broken support, the price may drop toward $1.70–$1.75 in the coming sessions.
XRP RSI Drops Below 40 as Bearish Momentum Builds
The 4-hour Relative Strength Index (RSI) for XRP dropped to 37.15 on June 22, 2025, confirming weakening momentum. The RSI moving average (yellow line) stands at 40.05. This setup indicates growing bearish pressure in the market.

RSI measures the strength and speed of recent price changes. Readings below 50 signal bearish momentum, while levels under 30 mark oversold conditions. Currently, XRP’s RSI hovers just above oversold territory but continues trending down, aligning with the recent pennant breakdown.
The RSI peaked near 70 multiple times in early June, but each attempt was followed by a sharper drop. That consistent pattern of lower highs and lower lows confirms a downward shift in momentum. Now, with RSI failing to reclaim 50 and slipping below its average, sellers remain in control.
The RSI chart does not show any bullish divergence. Price and RSI are both declining together. This absence of divergence suggests the downtrend is intact. For a reversal to begin, RSI would need to make a higher low while price hits a lower low—a pattern not visible here.
In short, XRP’s RSI confirms bearish control. With no reversal signals, and RSI below both 50 and its average, price action may continue to decline in the short term.
XRP DMI Confirms Bearish Control as -DI Surges Above +DI
On June 22, 2025, the Directional Movement Index (DMI) for XRP confirms strong bearish momentum. The -DI (orange) spiked to 38.31, while the +DI (blue) dropped to 9.12. The Average Directional Index (ADX, red) climbed to 34.69, signaling a strengthening trend.

A bearish DMI signal occurs when -DI crosses above +DI, indicating sellers have taken control. This crossover happened days earlier and remains in place. The current gap between -DI and +DI is wide, reinforcing bearish dominance.
At the same time, the ADX rising above 25 and nearing 35 confirms that the trend has strength. ADX does not show direction but measures trend intensity. In this case, a strong ADX combined with high -DI suggests a powerful bearish trend is underway.
With -DI surging, +DI falling, and ADX rising, XRP’s price is likely to stay under pressure. These conditions reflect increasing sell-side momentum. The trend may continue unless a strong reversal flips +DI above -DI with weakening ADX.
In summary, XRP’s DMI setup confirms bearish dominance as of June 22. The downtrend remains intact, with momentum growing stronger according to this signal.
XRP Breaks Below Ichimoku Cloud With Strong Bearish Confirmation
As of June 22, 2025, XRP clearly trades below the Ichimoku Cloud on the 4-hour chart, confirming a strong bearish signal. The price dropped beneath the cloud boundary, and recent labels shifted from “Weak Bullish” to “Neutral Bearish,” reflecting the market’s weakening trend.

Ichimoku Cloud analysis helps identify trend direction and support/resistance zones. When price moves below the cloud, it typically confirms a bearish bias. In XRP’s case, the price stayed under the cloud for several sessions before the sharp breakdown, reinforcing the negative structure.
The leading span lines of the cloud have also twisted into a bearish configuration, with the future cloud projected red. This forward-looking feature suggests bearish momentum may continue. Additionally, XRP shows no signs of re-entering the cloud, which would be a minimum requirement for neutralizing the trend.
For a bullish shift to emerge, price would need to close above the cloud and signal a bullish Kumo breakout. That hasn’t happened. The recent Ichimoku signals—such as “Neutral Bearish” and “Weak Bearish”—support the current downtrend.
In summary, XRP’s movement under the Ichimoku Cloud confirms the dominance of sellers. The chart structure remains bearish as of June 22.