
Ethereum (ETH) price went through the wringer on June 20. It dropped below $2,400 before buyers fought back and recovered some of the lost ground. The prime altcoin’s collapse was not alone, as Bitcoin price also rose to cross above $106,000 before falling.
The sentiment surrounding Bitcoin also seems to have infected ETH. Both tokens traded sideways over the past few days. Judging by the crabbing of both the tokens and their colleagues, the market seems to be a near-even split between the bulls and the bears.
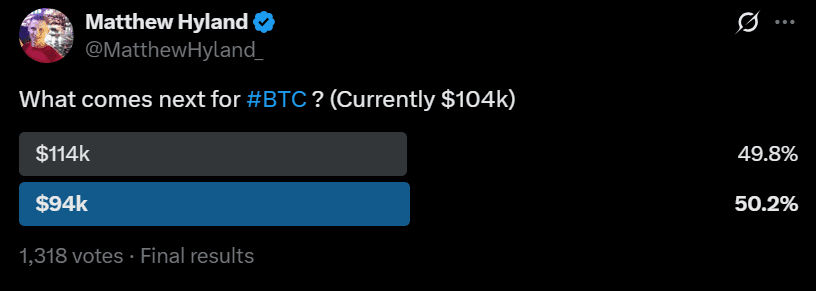
A more tangible proof of the market’s divide came from a poll by crypto analyst Matthew Hyland on X. Users’ responses revealed a nearly even split between traders expecting Bitcoin to rally to a new all-time high above $114,000 or drop back to $94,000.
The divided sentiment reflects broader market uncertainty and could just as easily mirror Ethereum traders’ position, especially with ETH stuck between key technical levels and a vulnerable short-term structure. However, recent institutional adoption could act as fuel when the market frees itself from the bears’ grip.
Ethereum Price Faces Sub-$2,000 Threat
Ethereum’s recent weekly candle printed a textbook doji, hinting at indecision. However, analysts remain firmly tilted to the downside.

According to a Tradingview analyst, the ETH/USD pair appears to have completed a motive wave at $2,700. It is now entering a corrective Wave 2, likely targeting the $2,250–$1,900 zone. The projected decline fits within a broader five-wave Elliott pattern that ultimately eyes $7,000 in 2026, but only after navigating significant downside risks in the near term.
The short-term structure suggests a high-probability pullback. The Tradingview analyst noted that “investors are positioning for a drop toward $1,900.” This is especially the case amid geopolitical instability and the recent altcoin decoupling from Bitcoin.
Moreover, the post emphasized that ETF inflows and staking data remain constructive, but are not yet strong enough to break the technical downtrend. With ETH still consolidating under resistance, the odds favor a bearish continuation unless a major macro catalyst intervenes.

The MVRV by Wallet Size chart added weight to the correction thesis. As of mid-June, wallets holding between 1,000 and 100,000 ETH show MVRV ratios hovering just above 1. This indicates that even large holders are sitting on slim unrealized profits, and a further price dip could push them into breakeven territory.
Historically, this setup has triggered capitulation events, especially when technical patterns align with thinning profit margins across whales. While smaller wallets are already deep in the red, the behavior of these large holders often dictates the broader trend.
For now, Ethereum faces elevated short-term risk. But structurally, it remains on course for a broader uptrend—if it can survive this corrective wave intact.
Bulls Fail To Hold Above $2,400- Is The Downtrend Here?
Ethereum has traded in a tight horizontal channel since early May 2025, maintaining position above the 20-week (red) EMA, now near $2,400. Historically, breaks below this EMA have triggered sharp corrections. Bulls have consistently defended this trendline, making it a crucial pivot for short-term structure.

Upside momentum remains capped by resistance near $2,670, which aligns with the 0.618 Fibonacci retracement.ETH price has failed to break above this level across multiple weekly attempts. A close above the immediate resistance could trigger a move toward the next resistance near $2,960, a level tied to prior consolidation zones.
Failure to hold above the $2,260 region would risk invalidating the current trend, likely exposing Ethereum to a retest of the $2,000 support zone. Since early May, this level has acted as a base and marks the next downside target if the trendline breaks.
The weekly RSI is neutral near 48.6, showing no immediate momentum bias. The next decisive move hinges on whether buyers can flip resistance or if selling pressure forces a breakdown below the established range. Until then, ETH would likely remain locked between well-defined technical boundaries.