
On June 2, 2025, ONDO/USDT formed a bearish rising wedge on the 1-hour chart. The price action moved between two upward-sloping, converging trendlines after a sharp drop on May 30.
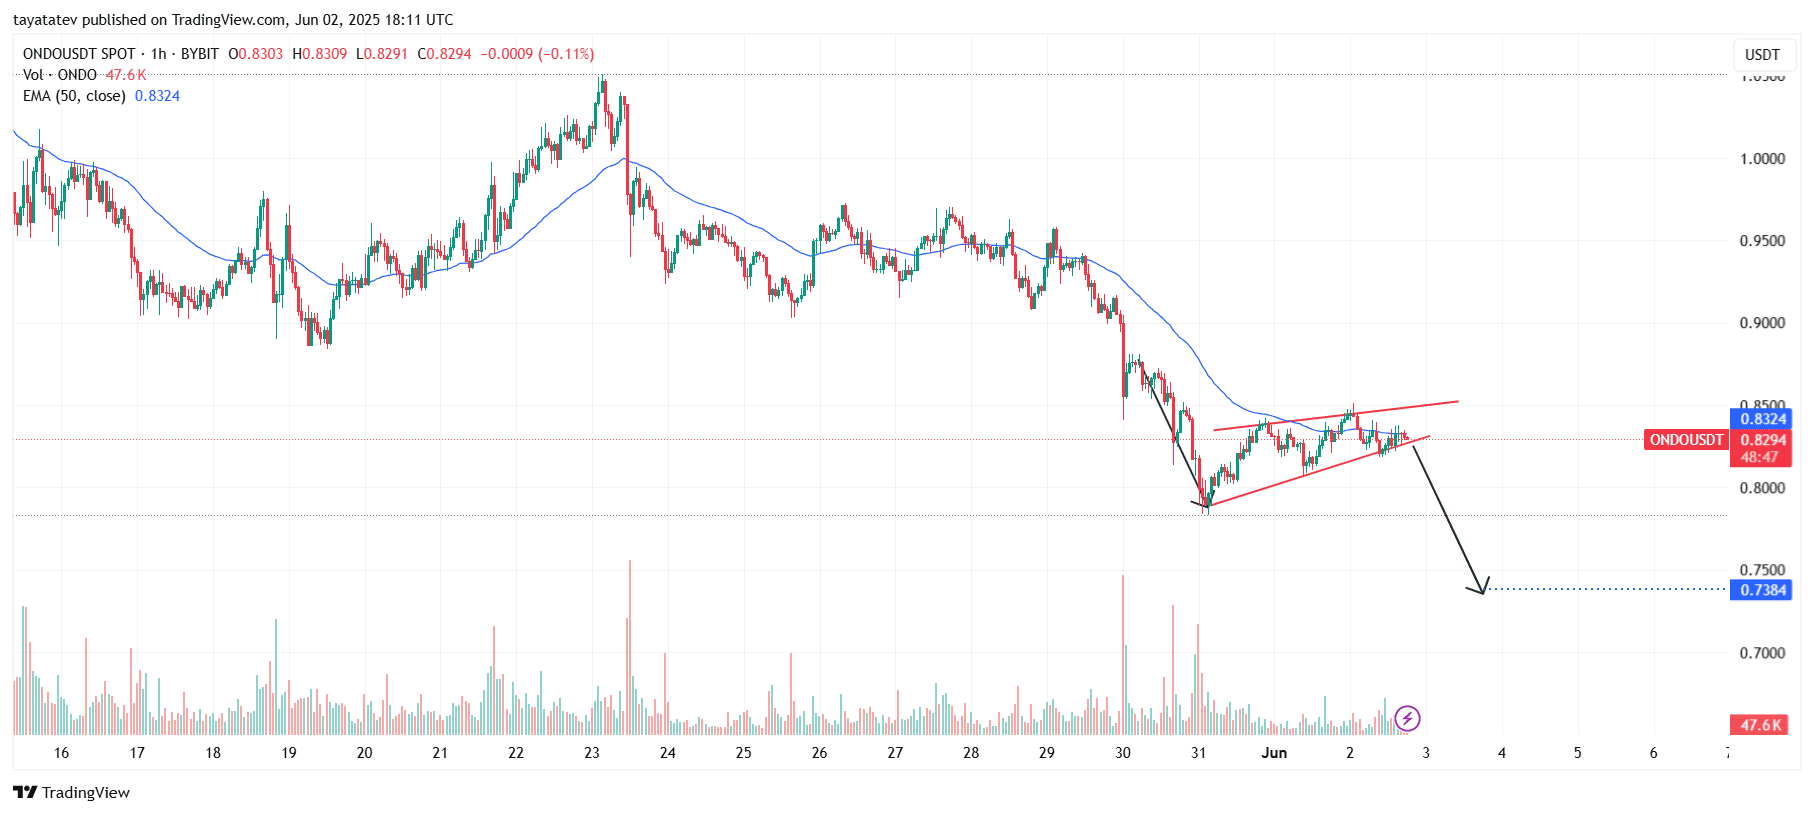
A bearish rising wedge typically signals a continuation of the previous downtrend and often leads to a breakdown once the lower support trendline fails.
If this bearish pattern confirms, ONDO’s price could drop nearly 12% from the current level of $0.8294. This move would send the token down toward the $0.7384 support area marked by the blue dotted line on the chart.
The 50-period Exponential Moving Average (EMA), currently at $0.8324, now acts as resistance, capping upward momentum. ONDO has failed multiple times to break and hold above this level.
Volume remains weak, indicating a lack of strong buying interest. At the same time, the chart shows lower highs within the wedge, further supporting the bearish bias. If sellers take control and push price below the wedge, the breakdown could accelerate quickly toward the projected target.
ONDO RSI Hovers in Neutral Zone Ahead of Potential Breakdown
On June 2, 2025, the Relative Strength Index (RSI) for ONDOUSDT on the 1-hour chart stood at 55.54. This level places RSI in the neutral zone, showing no clear bullish or bearish momentum.

Throughout the last week of May and early June, RSI fluctuated between 30 and 70, confirming a sideways consolidation. While it briefly dipped below 30 on May 30, suggesting oversold conditions, the quick rebound back above 50 reflects indecision in market direction.
The yellow line represents the RSI’s moving average (48.98), which acts as a dynamic midline. Right now, RSI trades slightly above it, indicating mild buying strength but lacking conviction.
Despite the short bounce, RSI shows no overbought signal and remains capped under the 70 level. Unless RSI breaks out of this range decisively, momentum will likely stay muted—supporting the bearish breakdown outlook seen in the price chart.
ONDOUSDT BBTrend Flashes Weakening Bullish Momentum
The BBTrend (Bollinger Band Trend) indicator for ONDOUSDT showed a value of 0.6056, signaling a slightly bullish trend. However, the histogram bars have started to decline, suggesting weakening upward momentum.
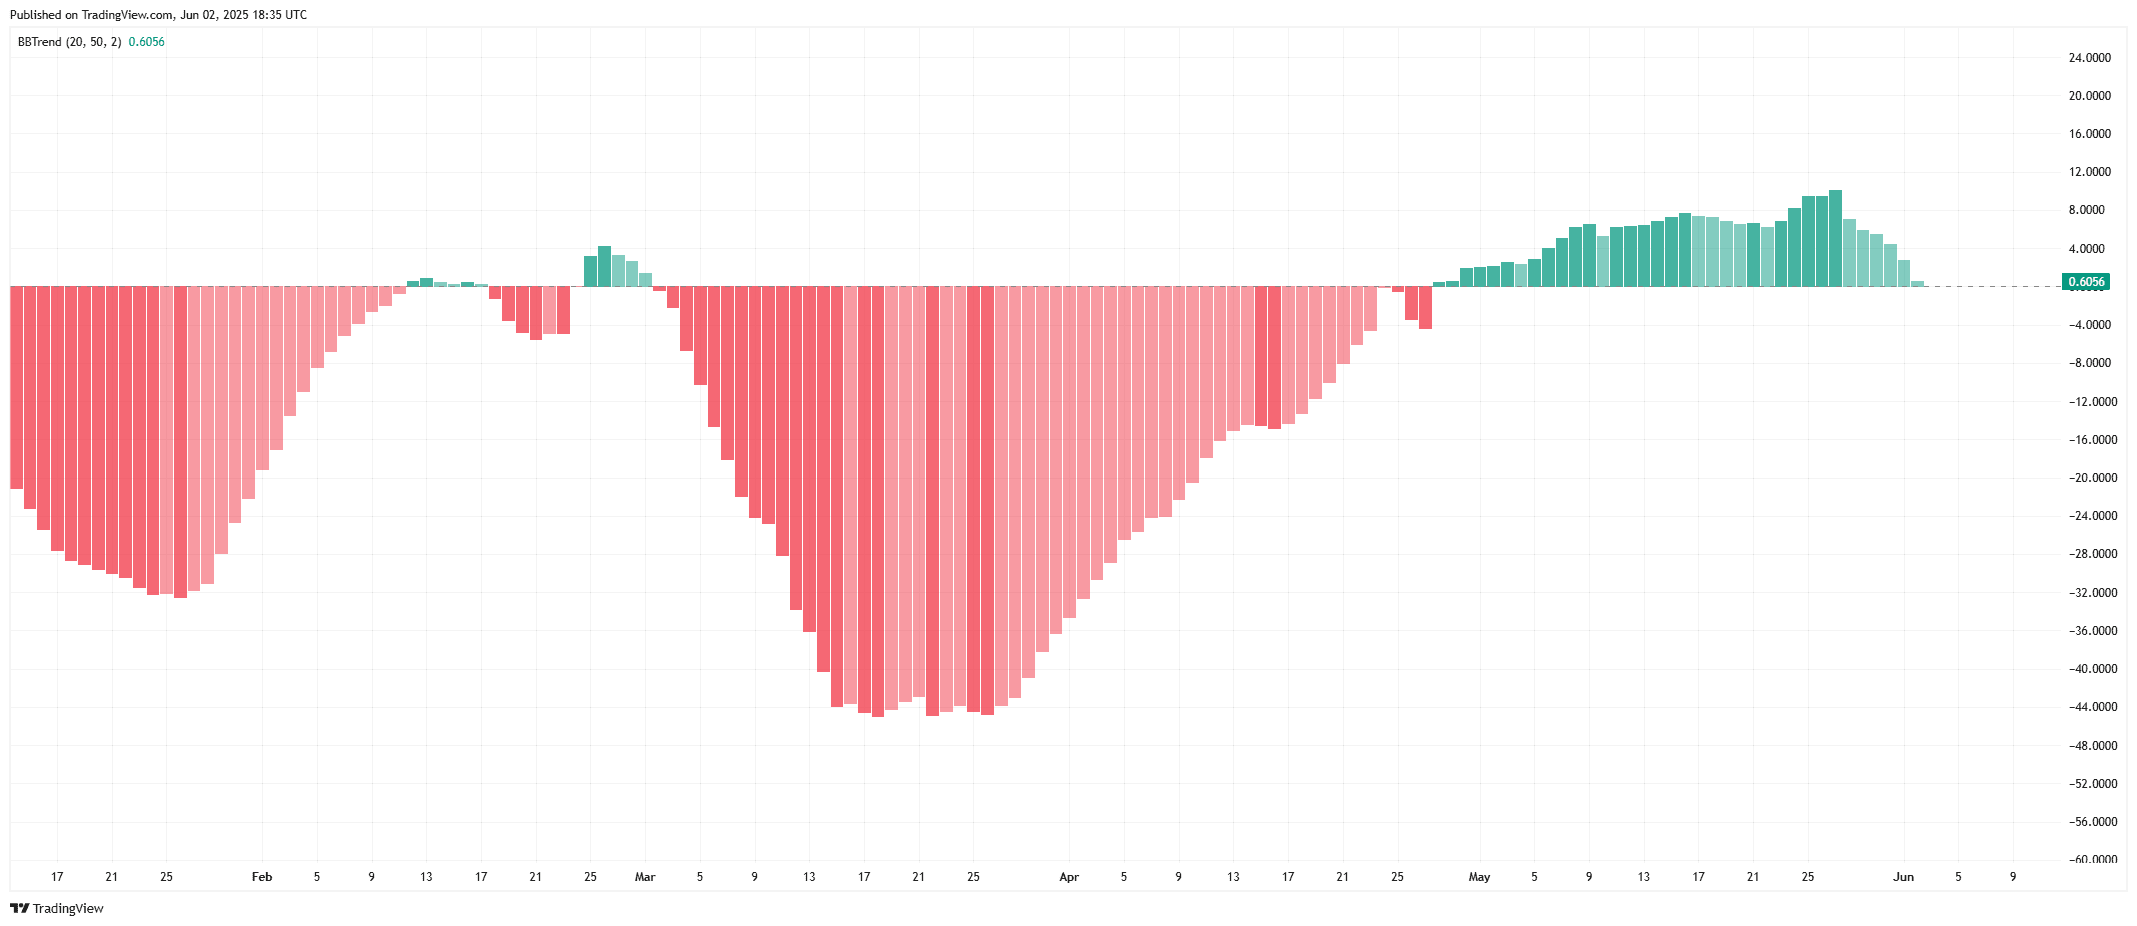
Throughout May, the BBTrend bars turned green and gradually increased, reflecting a shift from prolonged bearish pressure seen in March and April. During those months, the indicator printed deep red bars, indicating sustained downside momentum and strong selling activity.
Now, although the trend remains in bullish territory, the recent reduction in bar height points to potential exhaustion. If this decline continues, ONDO could revert to neutral or even bearish territory.
In summary, the BBTrend currently supports a mild uptrend, but momentum is fading. Traders may watch closely for a possible crossover back into negative territory if current conditions persist.
ONDOUSDT Trades Below Mid-Band, Signals Bearish Pressure in Bollinger Setu
As of June 2, 2025, ONDOUSDT trades at $0.8326, below the midline of its Bollinger Bands on the daily chart. The midline, currently at $0.9262, acts as a dynamic resistance and shows the trend is leaning bearish.
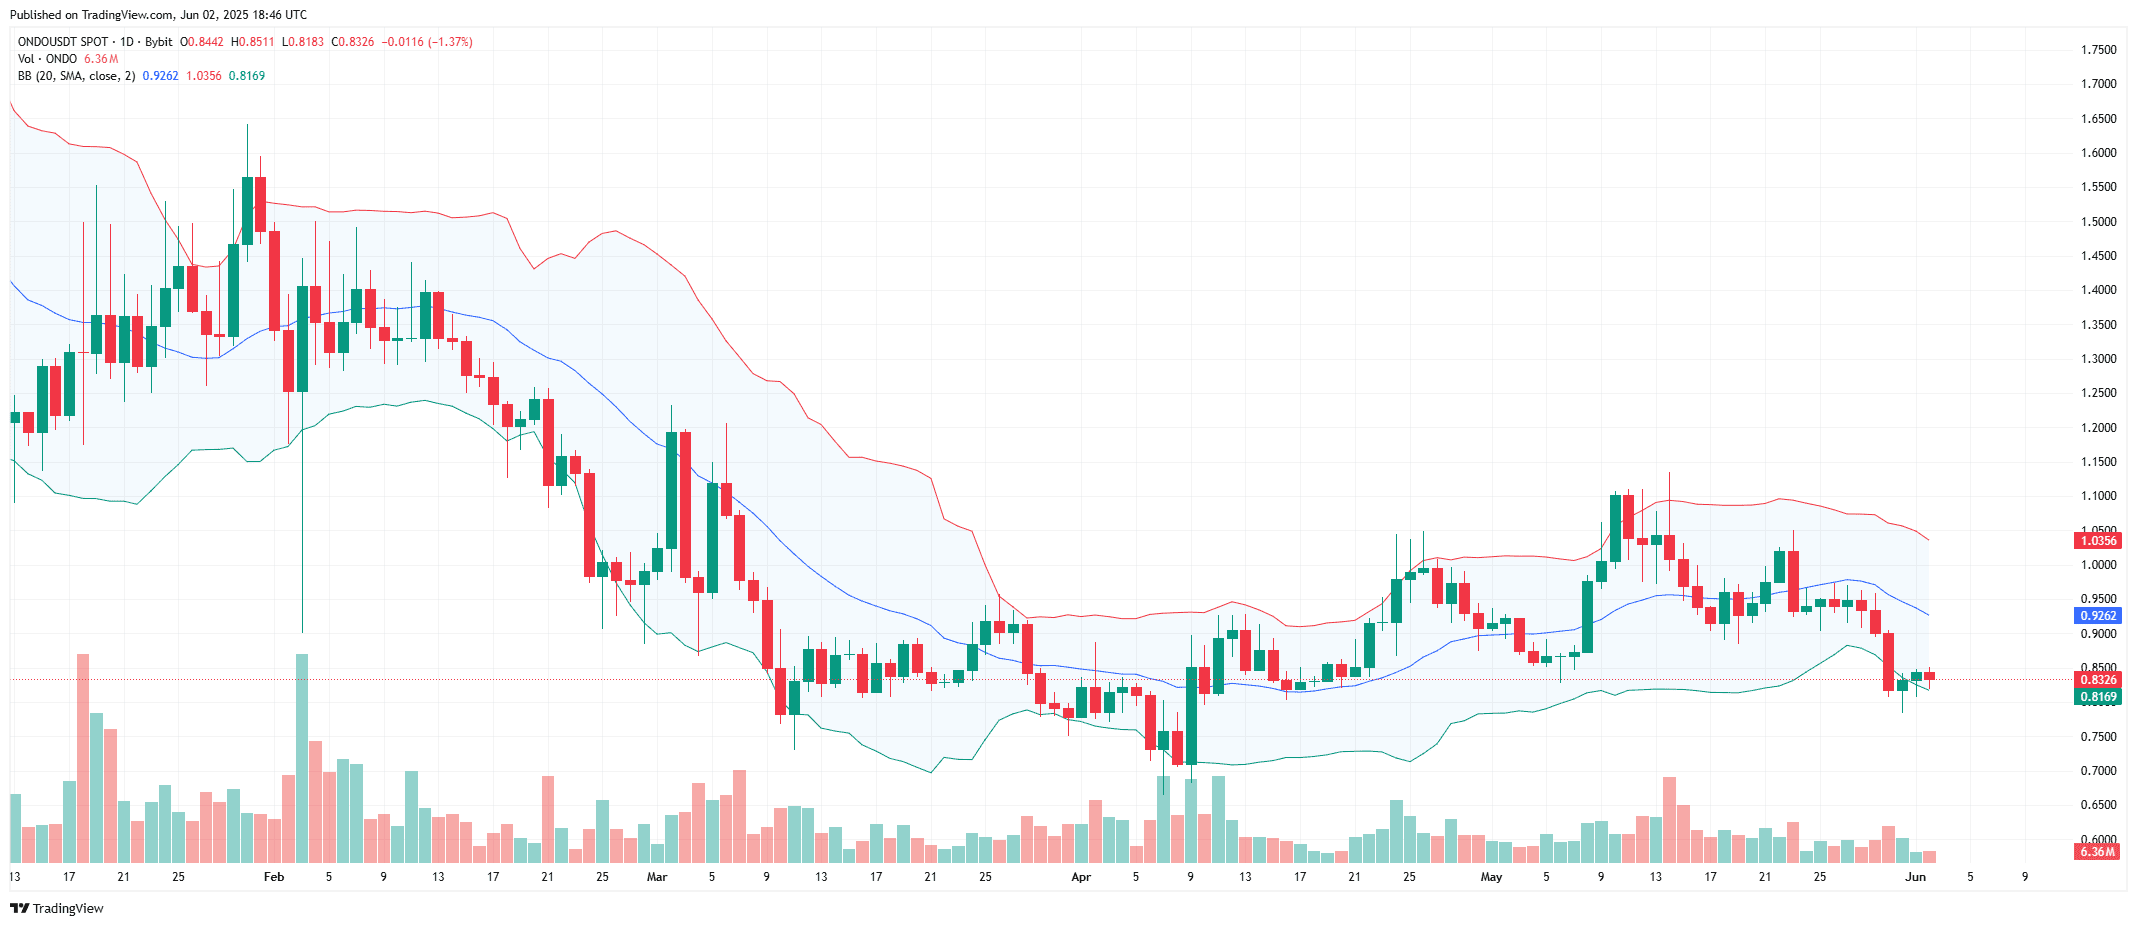
The lower band sits at $0.8169, and ONDO recently bounced off this zone. However, the price remains stuck in the lower half of the Bollinger envelope, which often signals continued selling pressure or weak recovery strength.
Volume shows no strong accumulation during this bounce, and the candles remain small-bodied, reinforcing the lack of conviction from buyers. Meanwhile, the upper band stands at $1.0356 — far from the current price — showing wide volatility but no clear breakout setup.
If ONDO fails to reclaim the mid-band soon, the probability of another test toward or below the lower band remains high. Traders often interpret this configuration as a warning that bearish control is not yet over.
ONDO Directional Momentum Weakens as ADX Flattens
Meanwhile,the ONDOUSDT DMI indicator shows a mixed trend. The Average Directional Index (ADX), marked in pink, stands at 18.07, indicating a weak overall trend. Typically, an ADX below 20 signals low momentum and a lack of strong directional bias.
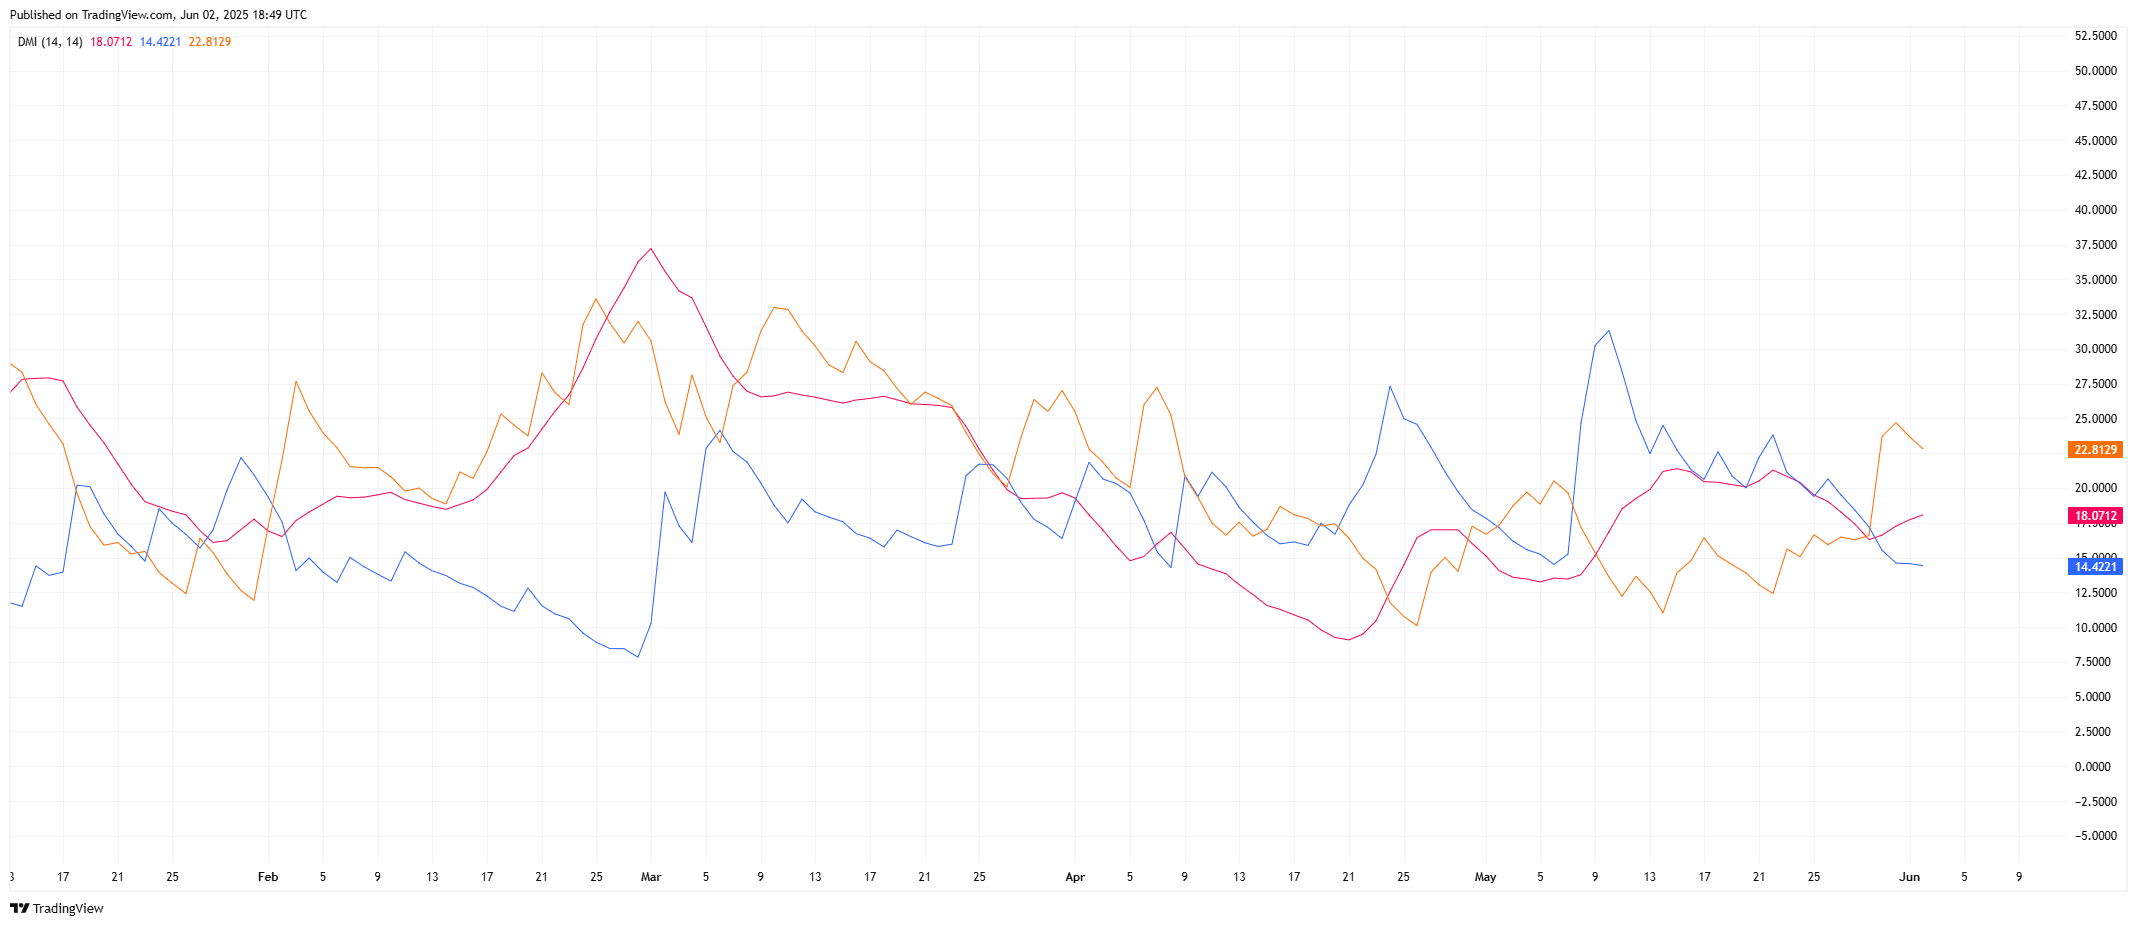
The +DI (orange) reads 22.81, while the -DI (blue) sits at 14.42. Since +DI is slightly higher, short-term bullish pressure exists. However, the wide fluctuations and recent crossovers between +DI and -DI suggest indecisiveness rather than clear trend continuation.
Previously, in early May, the -DI peaked sharply, confirming a short-lived bearish wave. But as June begins, all three DMI lines are close together, and ADX is flat—indicating market consolidation or possible reversal risk.
If ADX fails to rise, traders may interpret the signal as a lack of conviction in either direction. Price may remain range-bound unless volatility increases significantly.
ONDOUSDT MACD Crosses Bearish as Momentum Weakens Furthe
As of June 2, 2025, the Moving Average Convergence Divergence (MACD) indicator shows a confirmed bearish crossover. The MACD line (blue) sits at -0.0258, while the signal line (orange) is at -0.0091. This gap between the two lines indicates growing downside momentum.
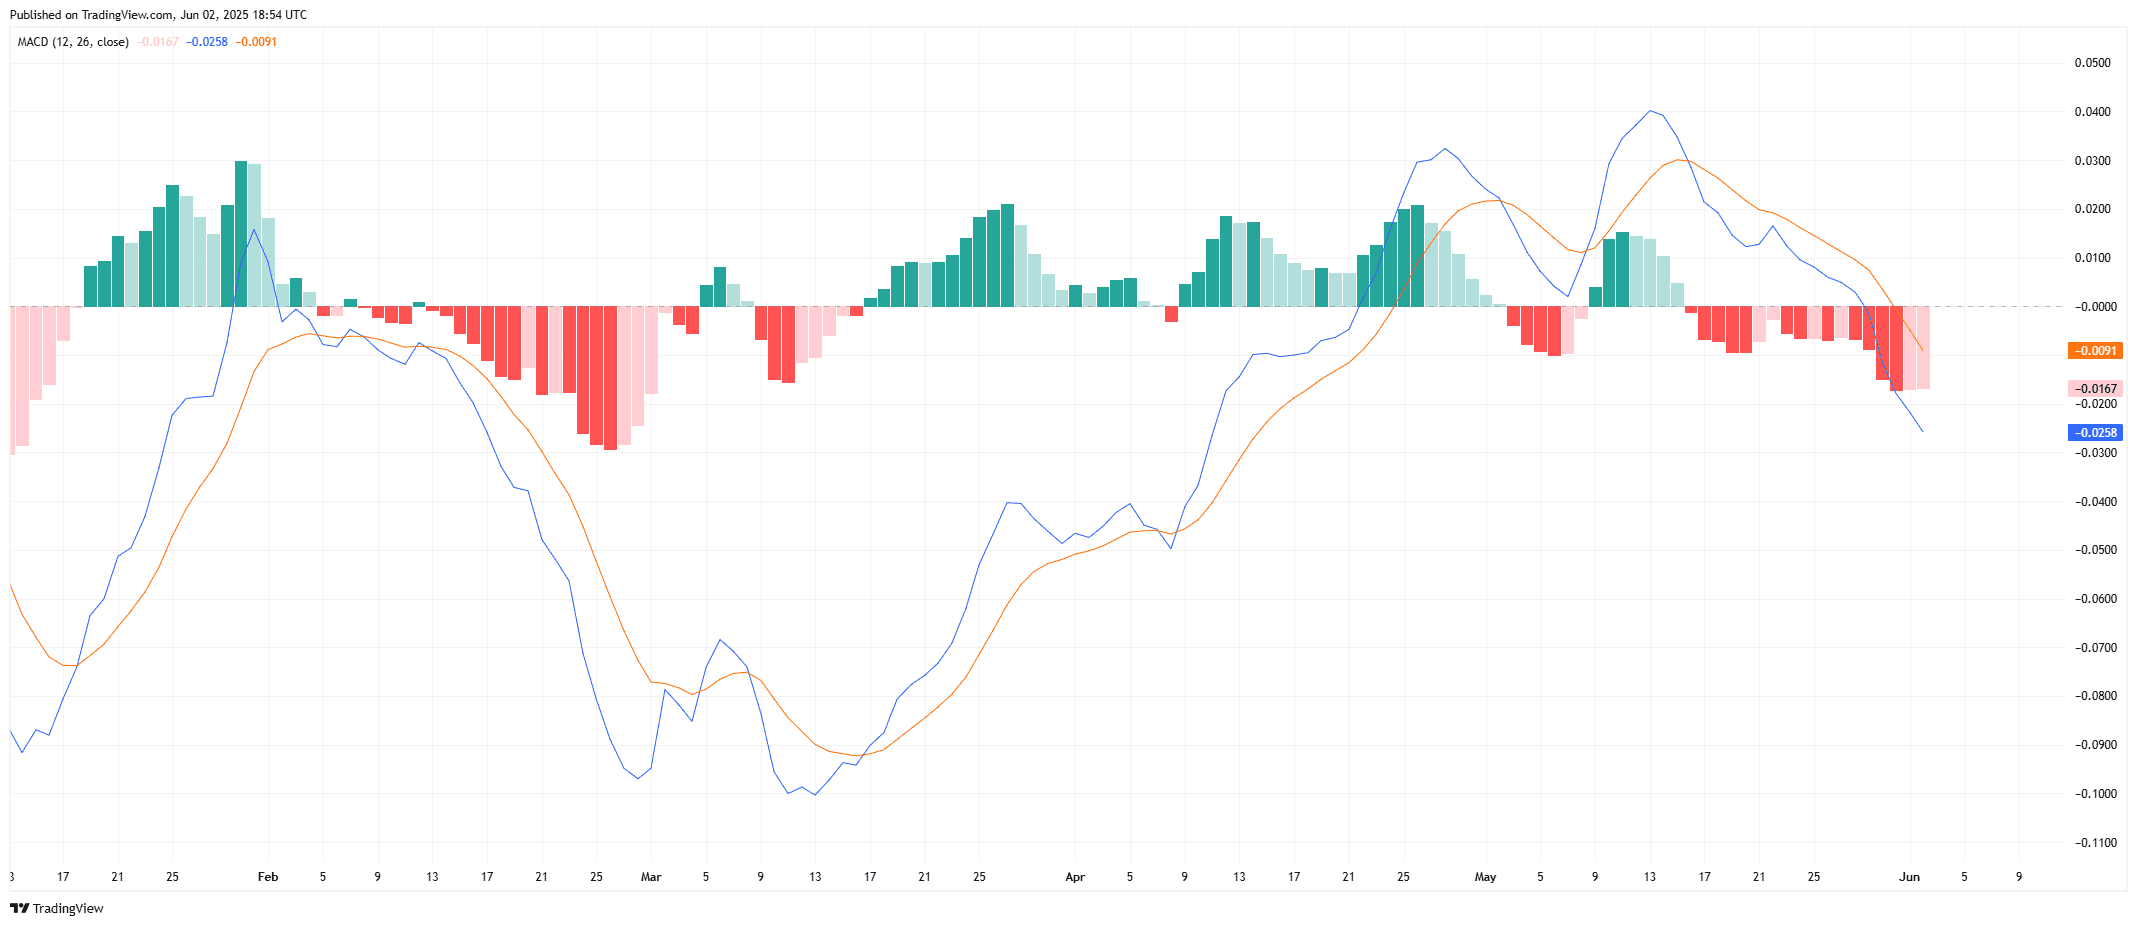
The histogram bars are red and increasing in size below the zero line, signaling that bearish pressure is accelerating. This shift follows a short-lived bullish phase in mid-May, which failed to sustain above the zero mark.
In previous cycles—such as March and early April—similar bearish crossovers triggered extended downward moves. The current structure now mirrors that pattern, with both lines trending downward and widening apart.
Unless the MACD line reverses and crosses back above the signal line, the chart suggests continued downside pressure on ONDO’s daily price action.