
Key Notes
- Cardano now leads Ethereum in core developer activity, signaling growing project engagement.
- ADA is trading around the crucial 0.618 Fibonacci level ($0.6910) with a bullish MACD.
- Cardano founder Charles Hoskinson predicts Ethereum’s decline within 10-15 years.
The narrative surrounding Cardano
ADA
$0.70
24h volatility:
2.3%
Market cap:
$25.04 B
Vol. 24h:
$749.45 M
is undergoing a significant shift. Long criticized as a “ghost chain,” recent data reveals that Cardano has now overtaken Ethereum in terms of core developer activity over the past year.
This “flippening” in developer engagement, as reported by Cryptometheus, shows Cardano boasting an impressive 21,439 GitHub commits across 550 core repositories in the last 12 months, placing it ahead of Ethereum’s 20,962 commits.
This surge in activity across Cardano’s 12 core projects and a wider ecosystem of 36 projects, encompassing 4,276 GitHub repositories, is challenging previous doubts about its utility and reigniting bullish sentiment for its native token, ADA.
ETH’s Downfall
Cardano founder Charles Hoskinson has further fueled this narrative by issuing a stark prediction: he anticipates Ethereum will face a significant downturn by 2040. Hoskinson attributes this to Ethereum’s “outdated tech,” layer 2 fragmentation, and now, its falling behind in developer activity.
Cardano Founder: “I don’t think #Ethereum will survive more than 10 years.” pic.twitter.com/BB1QRmhM2k
— Altcoin Daily (@AltcoinDailyio) April 23, 2025
He suggested Ethereum needs to reconsider its accounting model, virtual machine, and consensus mechanism, advocating for a shift towards technologies similar to Cardano’s Ouroboros-Leios and RISC-V based virtual machines.
The core of his concern, however, lies in Ethereum’s lack of effective on-chain governance, which he believes will hinder its ability to adapt and evolve, ultimately leading to its decline within the next 10 to 15 years as competing ecosystems gain traction.
ADA Price Analysis
According to CoinMarketCap data, ADA trades at $0.70, hovering around the 0.618 Fibonacci level ($0.6910). A sustained hold above this level could indicate continued bullish momentum, potentially targeting the 1 Fibonacci level at $0.7533 and then the 1.618 level at $0.8509.
Conversely, a break below the 0.618 level could see price retrace towards the 0.5 Fibonacci level ($0.654) and potentially lower.
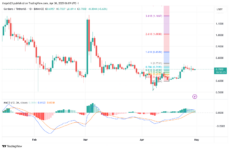
ADA Daily Chart | Source: TradingView
The MACD (Moving Average Convergence Divergence) indicator shows the MACD line (blue) crossing above the signal line (orange), and both are currently above the zero line. This generally indicates bullish momentum is building.
The increasing height of the green histogram bars further supports this positive momentum. However, it’s important to note that the MACD lines are still relatively close, suggesting the momentum is not yet overwhelmingly strong and could be subject to change.
next
Disclaimer: Coinspeaker is committed to providing unbiased and transparent reporting. This article aims to deliver accurate and timely information but should not be taken as financial or investment advice. Since market conditions can change rapidly, we encourage you to verify information on your own and consult with a professional before making any decisions based on this content.

A crypto journalist with over 5 years of experience in the industry, Parth has worked with major media outlets in the crypto and finance world, gathering experience and expertise in the space after surviving bear and bull markets over the years. Parth is also an author of 4 self-published books.
Parth Dubey on LinkedIn